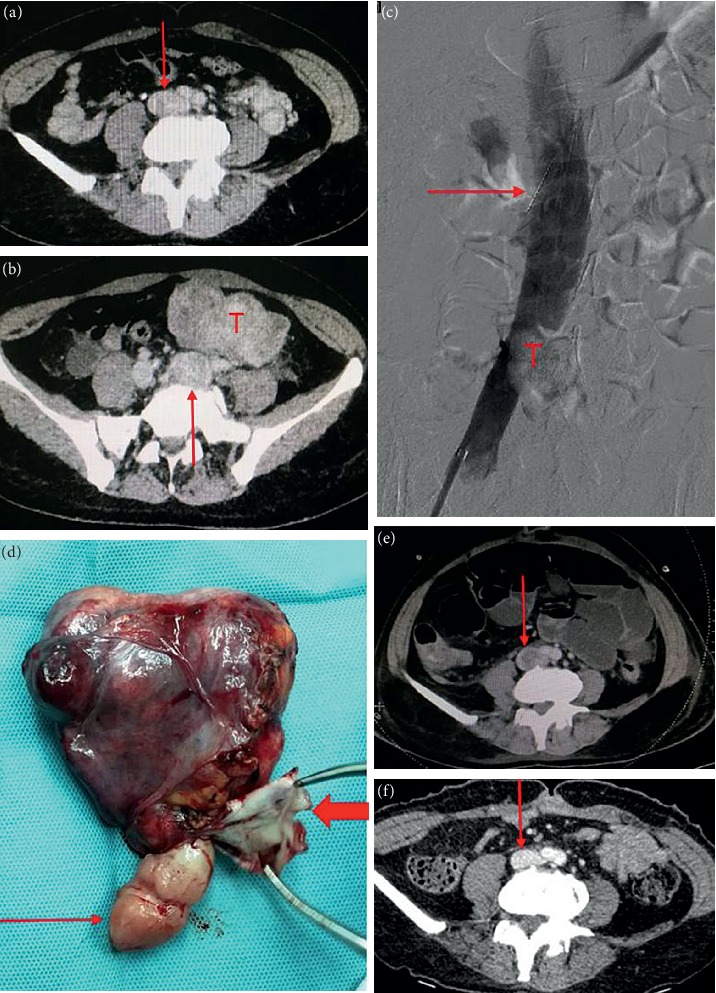
Figure 1.

Case 1. (a) Enhanced CT shows uneven intensity in the inferior vena cava (arrow). (b) Marked dilation of the left common iliac vein (arrow), with the same density as pelvic tumor (T). (c) Angiography shows the filling defect of the inferior vena cava (T), with arrow indicating the filter of the inferior vena cava. (d) The tumor specimen. Thin arrow indicates the tumor in the inferior vena cava, and thick arrow indicates the wall of the left internal iliac vein. (e) CT reexamination at 1 month after surgery shows thrombus formation at the beginning of inferior vena cava (arrow). (F) CT shows thrombus disappearance of inferior vena cava at 2 months after anticoagulation.
