Figure 1.
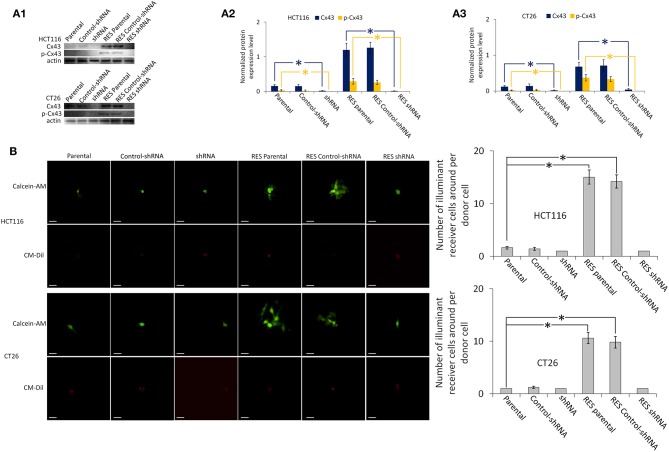
Cx43 expression and GJ function of HCT116 and CT26 cells, including parental, control-shRNA, and Cx43-shRNA transfected cells. RES, resveratrol-treated cells. All other groups were compared with the Parental group using one-way ANOVA. *P < 0.05 represents a significant difference from values in the Parental group. SEMs are shown as error bars. (A1) Western blot images of Cx43 and phospho-Cx43 (Ser-368). β-Actin is used as a loading control. The full-length blots are shown as Figure S7A. (A2,A3) Bar diagrams of densitometric analysis. Protein expression level is normalized by β-actin. (B) GJ function analysis by “Parachute” dye-coupling assay. Scale bars are 20 μm. Columns show the mean ± SEM. All images of “Parachute” dye-coupling assay are shown as Figure S1.

