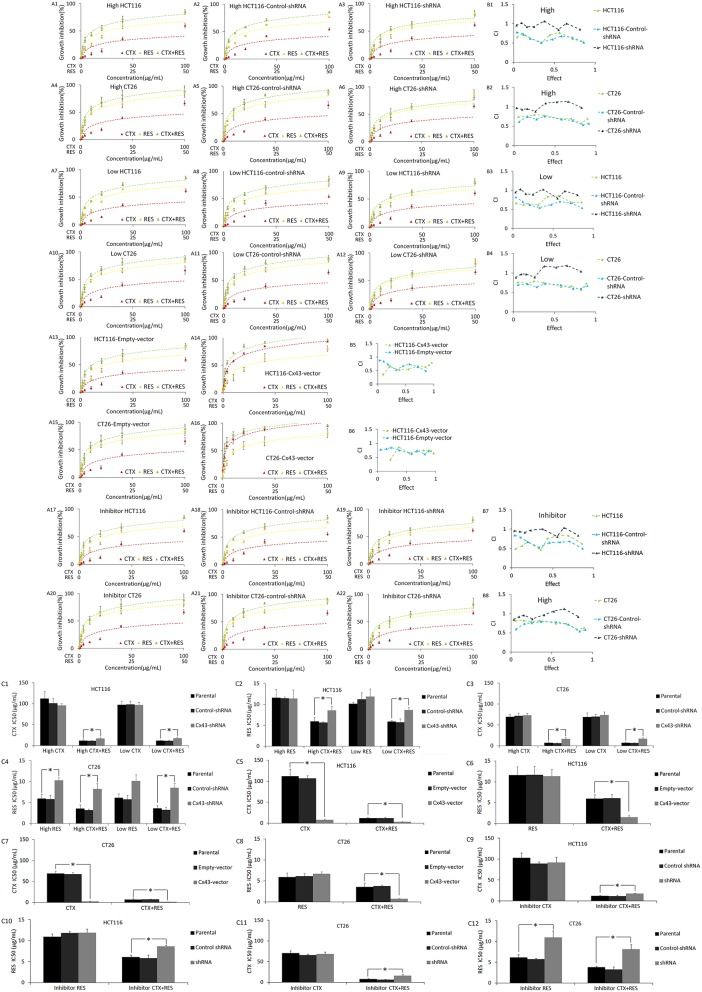
Figure 2.
Results of the MTT assay and CalcuSyn software analysis for parental, shRNA transfected, and Cx43 transfected HCT116 and CT26 cells. vector, pTARGET vector; CTX, cetuximab treatment; RES, resveratrol treatment; High, high density cultured cells (80%); Low, low density cultured cells (5%). (A) MTT assay results. The vertical axis represents growth inhibition rate, which is compared with that of untreated cells. The horizontal axis represents agent concentrations. Points represent mean ± SEM. Panels (A13–A16) are the results of high density culture cells. The raw data of MTT are shown as Supplementary Document 1. (B) CalcuSyn software analysis of the MTT assay results. CI, combination index. CI is calculated by calcusyn analysis based on the inhibition rate of different concentration of resveratrol and cetuximab. CI > 1 represents antagonistic cytotoxicity; CI = 1 represents addictive cytotoxicity; CI < 1 represents synergistic cytotoxicity. The data generated by CalcuSyn are shown as Supplementary Document 1. (C) IC50 (μg/ml) of cells to resveratrol and/or cetuximab. *P < 0.05 represents a significant difference between parental and transfected cells compared by one-way ANOVA. There is no significant difference between parental and control-shRNA in all conditions. The statistical difference of growth inhibition between parental and Cx43-shRNA transfected cells in different concentration is shown as Supplementary Document 1.

