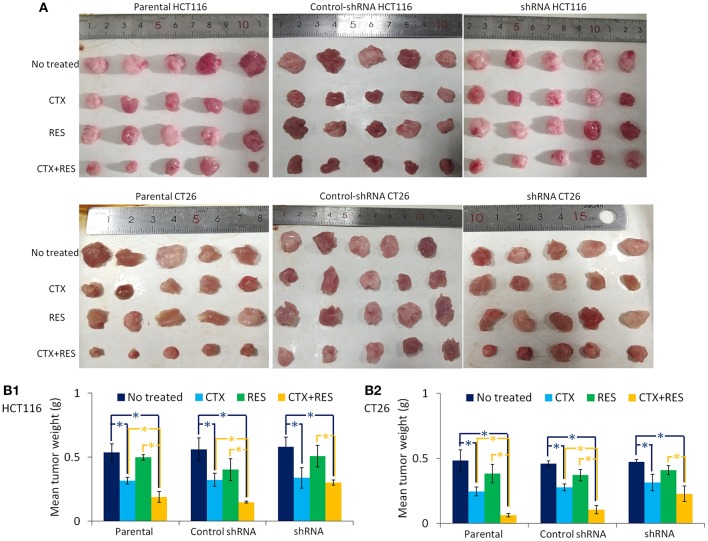
Figure 5.
Inhibition of tumor growth by cetuximab and resveratrol. CTX, cetuximab-treated mice; RES, resveratrol-treated mice. (A) The subcutaneous tumor model was created by parental, control-shRNA, or Cx43-shRNA-transfected cells. Each group contains five Balb/c mice for CT26 or nu/nu nude mice for HCT116. These mice were then treated with cetuximab and/or resveratrol for 14 days before sacrificed. Tumors were removed, and weight was measured using electronic balance. (B) Columns represent mean ± SEM volume from five tumors. Groups “CTX,” “RES,” and “CTX+RES” were compared with group “No treated” using one-way ANOVA. Blue *P < 0.05 represents a significant difference. Group “CTX+RES” was compared with group “CTX” and “RES” using one-way ANOVA. Yellow *P < 0.05 represents a significant difference.

