FIGURE 4.

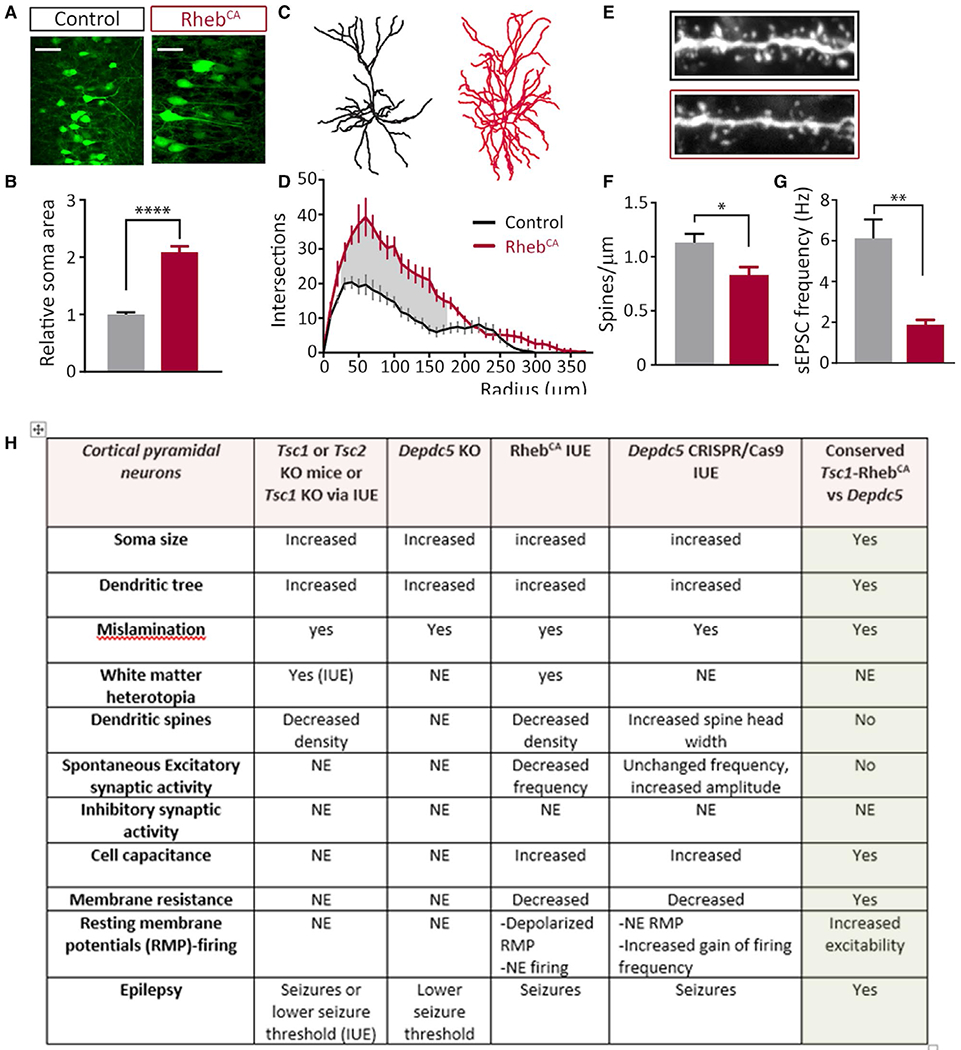
Conserved and nonconserved cellular abnormalities in mTOR-related MCDs (Figure modified from 8, 9). A, Mice were electroporated with GFP (control) or varying concentrations of GFP+ RhebCA plasmids at E15, targeting layer 2/3 neurons in the cortex. Pups were screened for successful electroporation via GFP expression at P0. Mice were monitored with video-EEG recording for 5–7 consecutive days at 2–4 mo of age and afterward euthanized for histologic and immunohistochemical analysis. Scale bar: 50 μm. B, Quantification of soma areas of layer 2/3 GFP+ cells in coronal sections from P28 control and RhebCA-electroporated mice shows neuronal enlargement. Areas were normalized to control soma area (n = 25 cells, three mice per condition, t test). C, D, Sholl analysis and representative traces of dendrites (n = 5-7 cells, three or four mice per condition, RM two-way ANOVA, Bonferroni post hoc). Shaded areas indicate radii where P <.05. E, F, Spine density quantification and images of basal dendrites in control and RhebCA neurons (n = 9-13 branches, three mice per condition, t test) (Magnification: H, 100×). G, Representative traces of spontaneous (s) EPSCs recorded from layer 2/3 neurons for each condition. RhebCA expression decreases sEPSC frequency (n = 8 or 9 neurons from four or five mice per condition). Scale bar: 20 pA per 0.2 s. *P <.05; ***P <.001; ****P <.0001. All data are presented as mean ± SEM. H, Table demonstrating similarities and differences between Tsc1, Tsc2, RhebCA, and Depdc5 animal models systems (see text)
