
Figure 1.
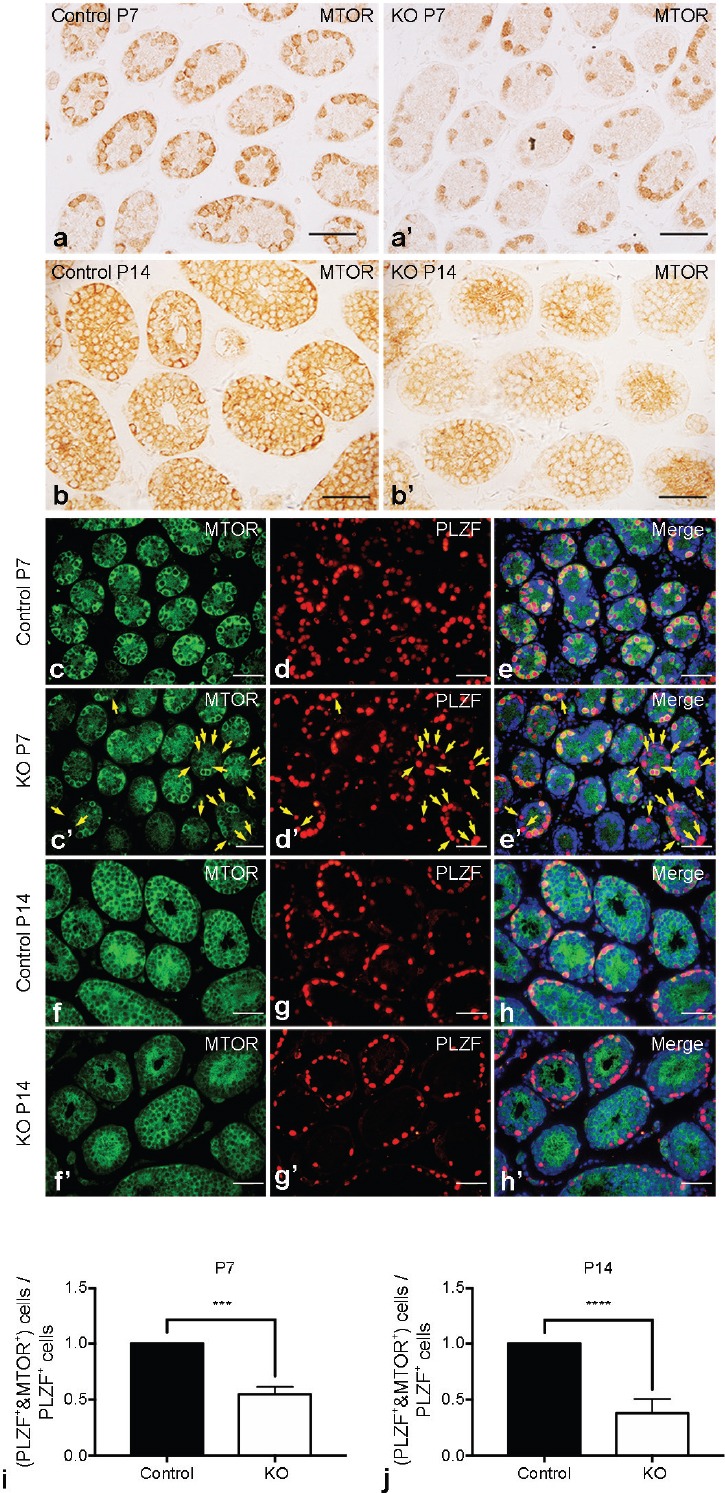
Verification of MTOR deletion in Mtor KO testes. Representative images of IHC for MTOR in the testes of postnatal day 7 (P7) (a) control and (a') Mtor KO mice. Representative images of IHC for MTOR in the testes of postnatal day 14 (P14) (b) control and (b') Mtor KO mice. Scale bar = 50 μm. Representative images of indirect immunofluorescence (IIF) for (c) MTOR and (d) PLZF, and (e) their merged images with DAPI (blue) in the testes of P7 control mice. Representative images of IIF for (c') MTOR and (d') PLZF, and (e') their merged images with DAPI (blue) in the testes of P7 Mtor KO mice. Golden arrows indicate PLZF-positive cells with no MTOR expression. Representative images of IIF for (f) MTOR and (g) PLZF, and (h) their merged images with DAPI (blue) in the testes of P14 control mice. Representative images of IIF for (f') MTOR and (g') PLZF, and (h') their merged images with DAPI (blue) in the testes of P14 Mtor KO mice. Scale bar = 50 μm. Quantification of the proportion of PLZF+/MTOR+ germ cells in the testes of (i) P7 and (j) P14 control and Mtor KO mice. IHC: immunohistochemistry. ***P < 0.001; ****P < 0.0001.