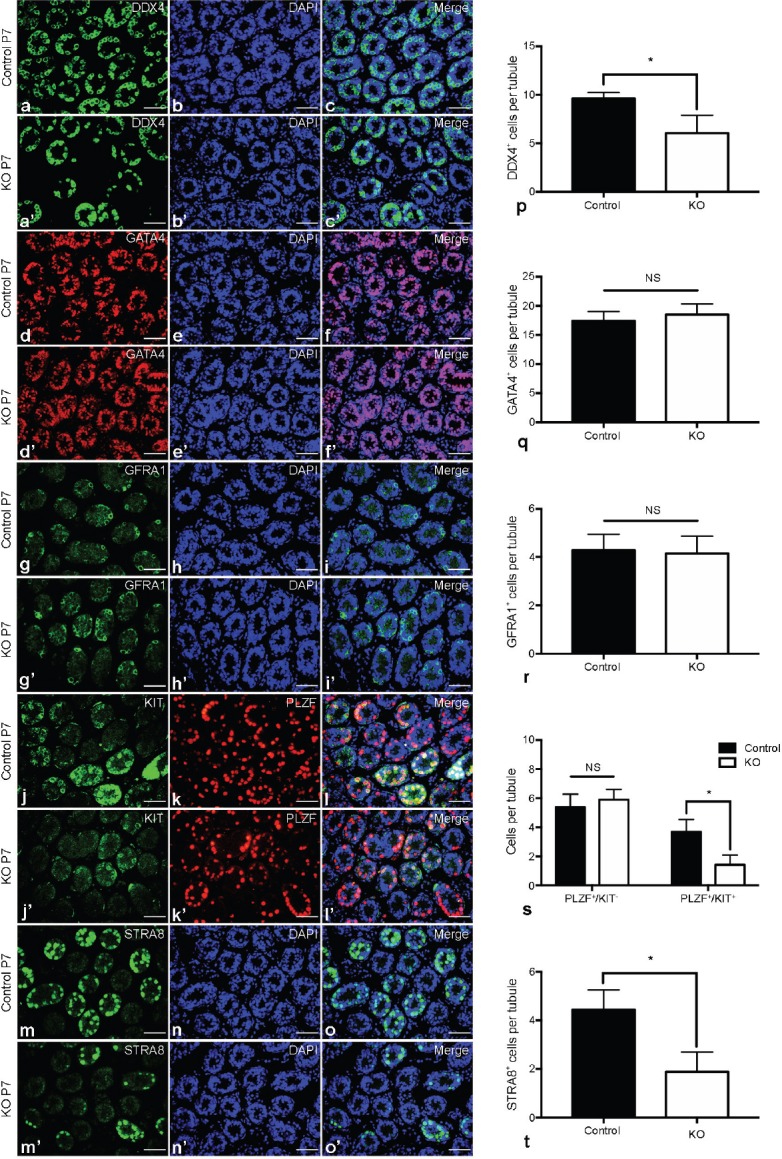
Figure 3.

Spermatogonial differentiation in P7 Mtor KO testes. Representative images of indirect immunofluorescence (IIF) for (a) DDX4 and (b) DAPI, and (c) their merged images in the testes of P7 control mice. Representative images of IIF for (a') DDX4 and (b') DAPI, and (c') their merged images in the testes of P7 Mtor KO mice. Representative images of IIF for (d) GATA4 and (e) DAPI, and (f) their merged images in the testes of P7 control mice. Representative images of IIF for (d') GATA4 and (e') DAPI, and (f') their merged images in the testes of P7 Mtor KO mice. Representative images of IIF for (g) GFRA1 and (h) DAPI, and (i) their merged images in the testes of P7 control mice. Representative images of IIF for (g') GFRA1 and (h') DAPI, and (i') their merged images in the testes of P7 Mtor KO mice. Representative images of IIF for (j) KIT and (k) PLZF, and (l) their merged images with DAPI (blue) in the testes of P7 control mice. Representative images of IIF for (j') KIT and (k') PLZF, and (l') their merged images with DAPI (blue) in the testes of P7 Mtor KO mice. Representative images of IIF for (m) STRA8 and (n) DAPI, and (o) their merged images in the testes of P7 control mice. Representative images of IIF for (m') STRA8 and (n') DAPI, and (o') their merged images in the testes of P7 Mtor KO mice. Scale bar = 50 μm. Quantification of (p) DDX4+, (q) GATA4+, (r) GFRA1+, (s) PLZF+/KIT-, PLZF+/KIT+ and (t) STRA8+ germ cells in the testes of P7 control and Mtor KO mice. *P < 0.05.
