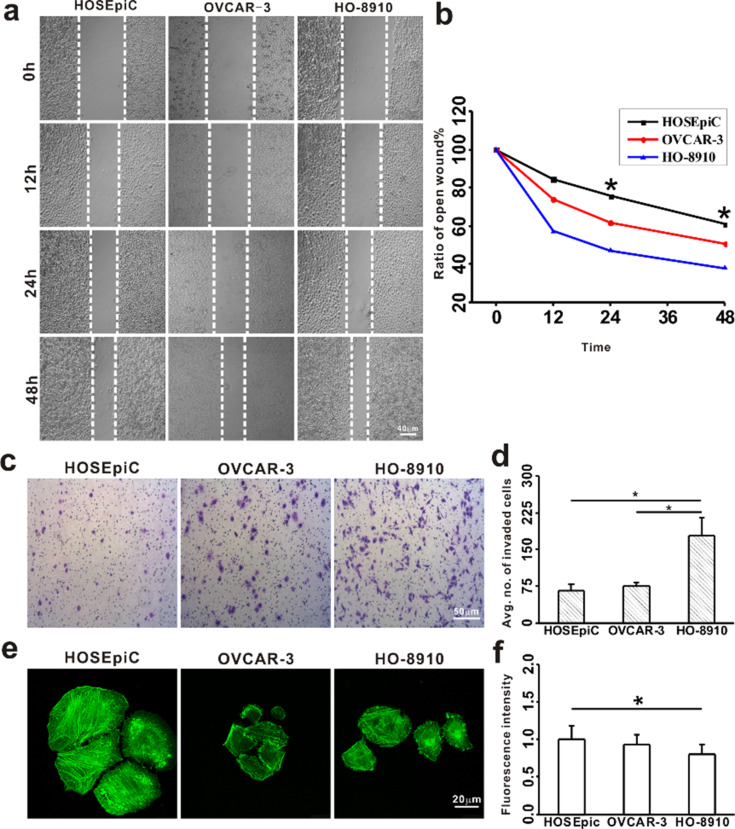
Figure 2.
Analysis of tumorigenic properties of ovarian cancer cells. Migration and invasion of ovarian cancer cells were analyzed and the microfilament density was examined by imaging cytoskeleton F-actin. a: HO-8910, OVCAR-3 and HOSEpiC cells were cultured for 0 h, 12 h, 24 h and 48 h and the healing of cell scratches was observed; scale bar = 40 μm. b: The migration of ovarian cancer cells was calculated and the asterisk indicates p < 0.05. c: The invasion of ovarian cancer cells was examined; scale bar = 50 μm. d: The invasion of ovarian cancer cells was analyzed and the asterisk indicates p < 0.05. e: The microfilament density was examined by imaging cytoskeleton F-actin; scale bar = 20 μm. f: The microfilament density was analyzed and the asterisk indicates p < 0.05.

