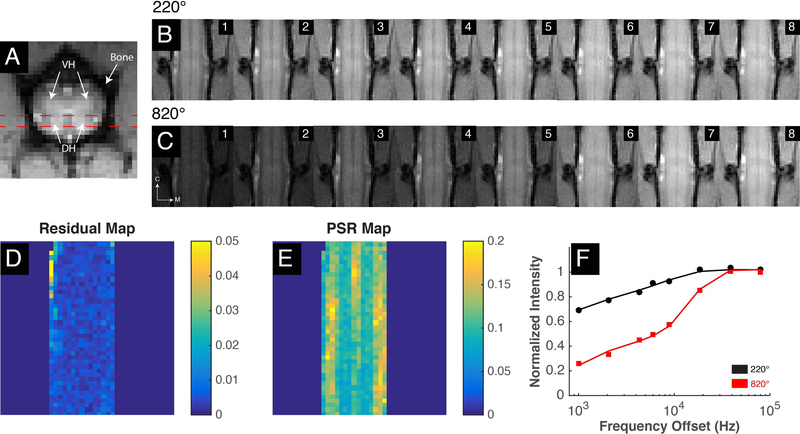
Figure 1: QMT acquisition and analysis for healthy lumbar spinal cord.
(A) High resolution axial MTC image with red dashed lines indicating coronal acquisition plan covering dorsal horns and the dorsal column. (B-C) Cropped raw qMT data collected at eight different frequency offsets and at two flip angles of 220° and 820° respectively. M: medial; C: caudal. (D-E) Square 2-norm of residuals and PSR map from qMT model fitting. (F) Curves of normalized intensity in selected white matter voxel with fitted model curves for 220° and 820° represented as black and red colors respectively. Doral horns, DH; Ventral horns, VH.

