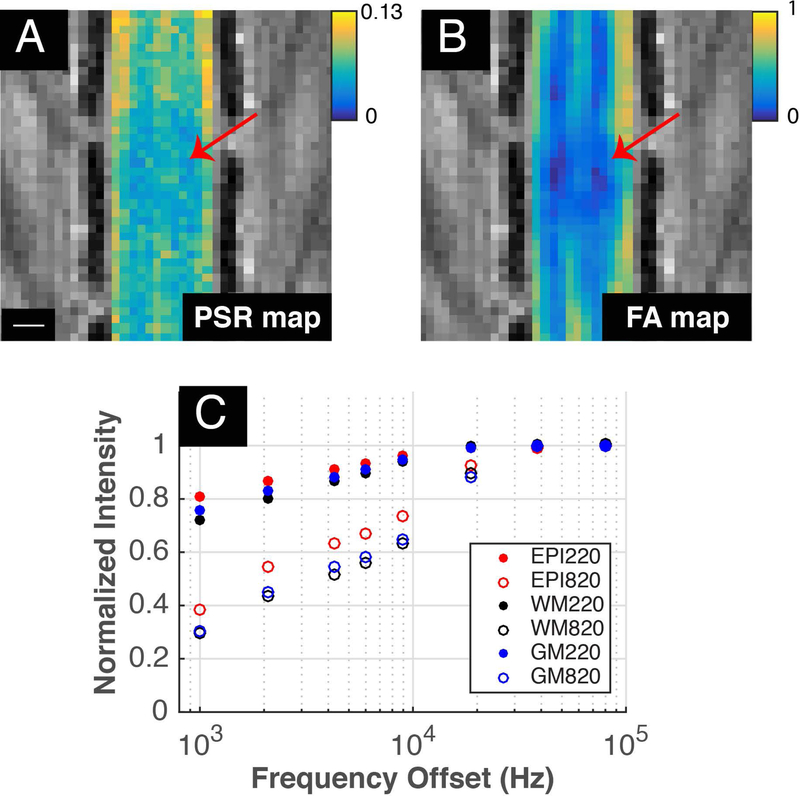
Figure 2: PSR and FA maps with MT curve post-SCI.
(A) PSR and (B) FA maps 24 hours post-SCI. Red arrows indicate epicenter of the injury while scale bar represents 1mm. (C) ROIs were drawn at the epicenter (red) as well as at gray (blue) and white (black) matter at least 5mm away from the epicenter. MT spectra of these ROIs at flip angles 220° (filled) and 820° (unfilled) are displayed.

