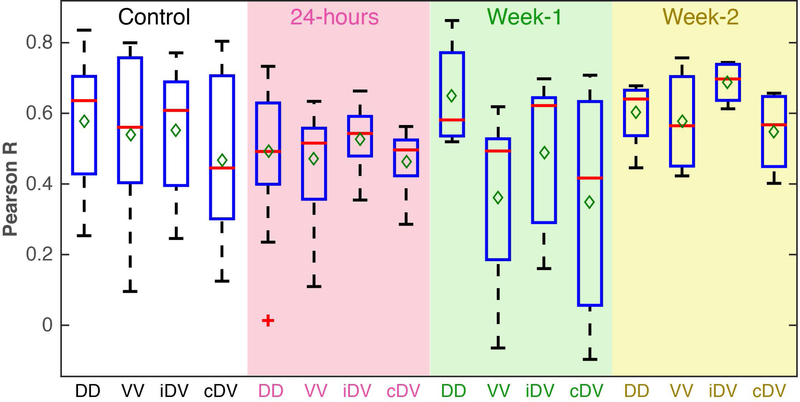
Figure 9: Longitudinal functional connectivity changes post-SCI below the injury site.
Boxplots between each spinal horn in controls (white background), 24-hours (pink background), Week-1 (green background) and Week-2 (yellow background) post-injury. Boxplots at each timepoint contains 14 runs (four animals), 21 runs (five animals), 5 runs (two animals) and 4 runs (one animal) for controls, 24-hours, Week-1 and Week-2 respectively. Red lines and green diamonds represent medians and means of each boxplot respectively. Dorsal-dorsal horn connectivity, DD; Ventral-ventral horn connectivity, VV; ipsilateral dorsal-ventral horn connectivity, iDV; contralateral dorsal-ventral horn connectivity.

