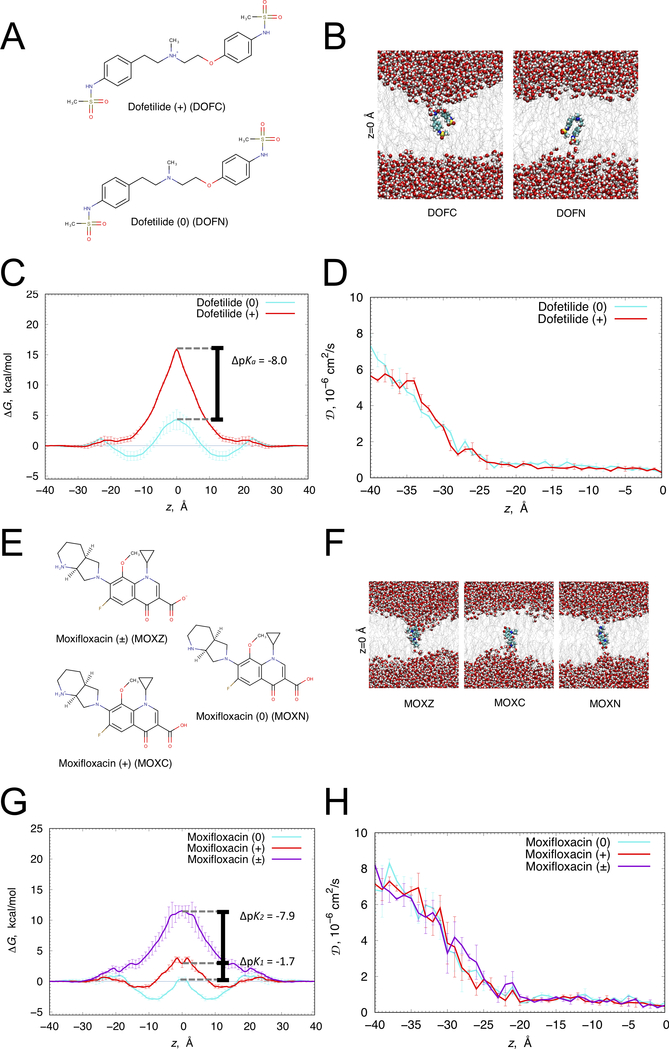
Figure 1. Translocation of dofetilide and moxifloxacin across a hydrated lipid membrane.
(A) Chemical structures of cationic (top) and neutral (bottom) dofetilide. (B) Representative snapshots of dofetilide at the center of POPC bilayer (z = 0) from umbrella sampling molecular dynamics simulations. Dofetilide and water molecule are in space-filling representation (C – cyan, O – red, N – blue, S – yellow, H – white), lipid tails are shown as gray sticks. (C) Free energy (ΔG) and (D) diffusion coefficient (D) profiles of neutral (cyan) and cationic (red) dofetilide crossing POPC membrane. (E) Zwitterionic (top), neutral (right) and cationic (bottom) moxifloxacin chemical structures. (F) Representative snapshots of moxifloxacin at the center of DMPC bilayer (z = 0) from umbrella sampling molecular dynamics simulations. Moxifloxacin and water molecule are in space-filling representation (F – pink, C – cyan, O – red, N – blue, H – white), lipid tails are shown as gray sticks. (G) ΔG and (H) D profiles of zwitterionic (purple), neutral (cyan) and cationic (red) moxifloxacin crossing DMPC membrane. Error bars represent standard errors of mean computed based on profile asymmetries with respect to z = 0.

