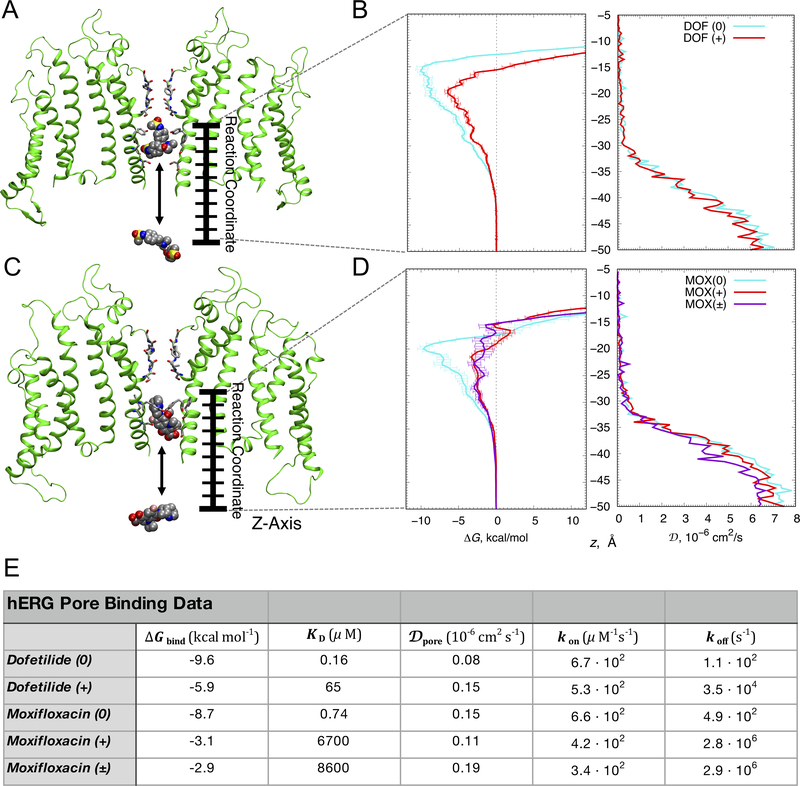
Figure 2. Open state hERG block by dofetilide and moxifloxacin.
(A, C) The representative open state hERG structures (two opposite chains shown as green ribbons) used to compute binding free energy (ΔG) and diffusion coefficient (D) profiles for dofetilide (panel A) and moxifloxacin (panel C). Drug molecules inside the hERG ßpore (top) and in bulk solvent (bottom) are in space-filling representation (C – gray, O – red, N – blue, S – yellow, F – pink, H – white), (B, D) ΔG (left) and D (right) profiles for dofetilide (panel B) and moxifloxacin (panel D) interactions, showing dominant binding wells of –10.1 kcal/mol and –6.6 kcal/mol at z = –15.5 Å and z = –20 Å for neutral (cyan) and cationic (red) dofetilide and –9.7 kcal/mol, –3.3 kcal/mol, and –2.9 kcal/mol at z = −20 Å, z = −21.5 Å and z = −22.5 Å, for neutral (cyan), cationic (red) and zwitterionic (purple) moxifloxacin. Error bars for ΔG profiles represent standard errors of mean computed from block averages. D values in the hERG pore (Dpore) of both dofetilide and moxifloxacin were comparable irrespective of drug ionization state as shown in panels B and D, right. (E) Drug binding affinities (ΔGbind and KD), diffusion coefficients (Dpore) and drug “on” (kon) and “off” (koff) rates computed from the umbrella sampling molecular dynamics simulations.

