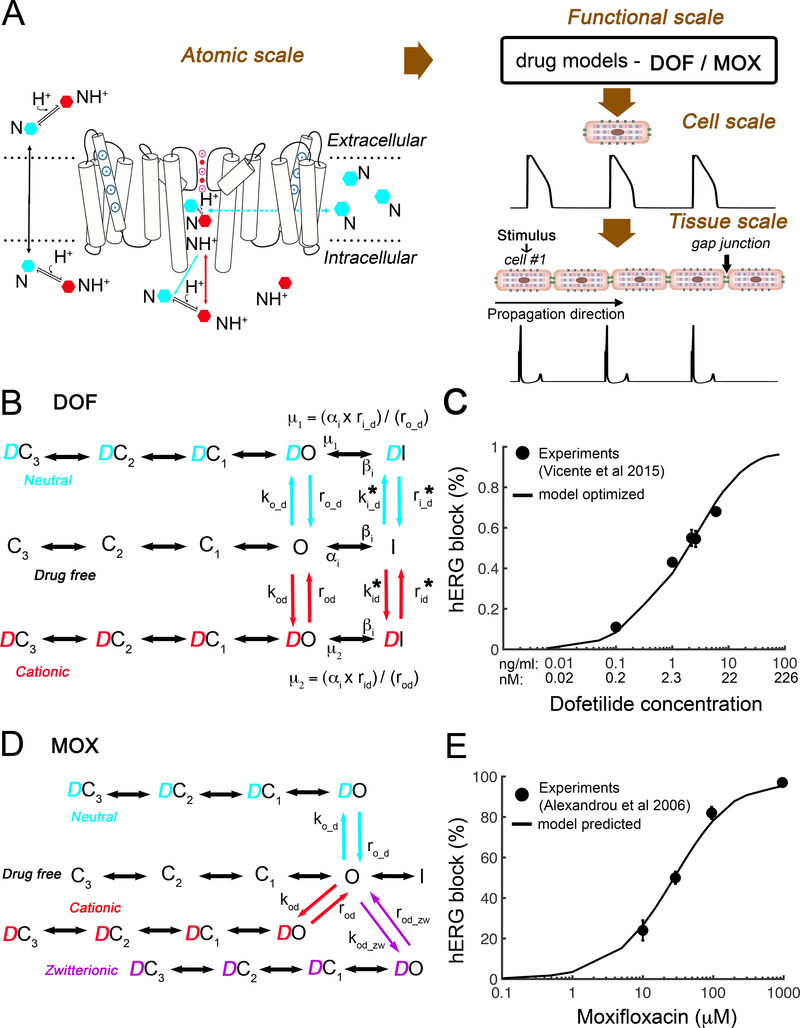
Figure 3. Concentration dependent block of hERG by dofetilide and moxifloxacin.
(A) Schematic diagram presents the connection of atomistic scale model of drugs interaction with the hERG channel (left) to the corresponding functional protein scale model (B and D) used in single-cell to tissue level simulations and computed pseudo ECG (bottom). (B) The Markov model represents a map of the hERG channel functional states. Drug free (black), cationic dofetilide bound (red) states, and neutral dofetilide bound (cyan) states are shown. (C) Experimentally measured dose dependent inhibition of hERG by dofetilide (black circles)56 and optimized model-based results (black curve). (D) The Markov model of hERG-moxifloxacin system: drug free (black), cationic drug bound (red) states, zwitterionic drug bound (purple), and neutral drug bound (cyan) states are shown. (E) Experimentally measured dose dependent inhibition of hERG by moxifloxacin (black circles)20 and model predicted results (black curve).

