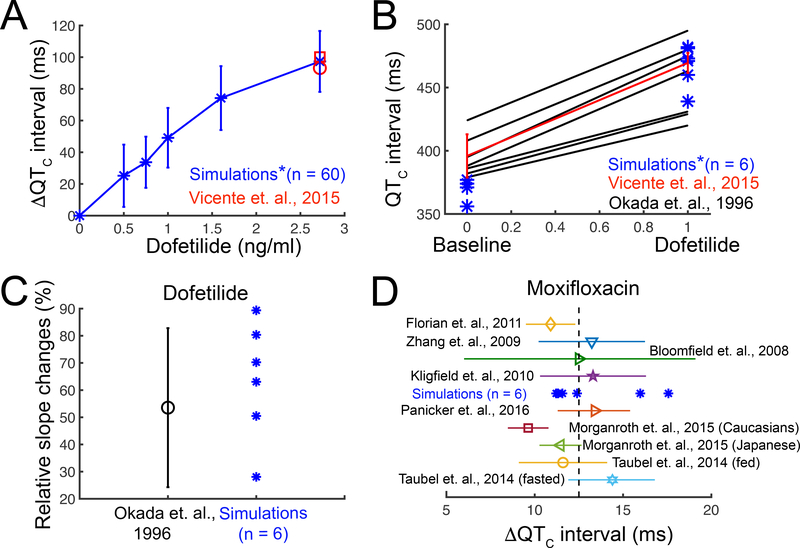
Figure 4. Validation of the drugs computational screening pipeline prototype with human clinical data.
(A) Heart rate corrected pseudo ECG ( ΔQTC interval) was computed from a 1-dimensional strand of O’Hara-Rudy human cardiac ventricular myocytes for pacing frequencies between 43 – 75 bpm for a range of dofetilide concentrations (blue) compared to clinical data (red). (B) Comparison of human clinical data showing control and dofetilide affected rate corrected QT intervals10, 56 (black and red lines) and simulated mean values under the same conditions (blue asterisks). Red line: two subjects received a single dose of 0.5 mg (population’s mean maximum concentration Cmax is 2.7±0.3 ng/mL). Blue asterisks (*): concentration 2.72 ng/mL (~6.16 nM) was used in the simulations. Black lines: subjects received 0.5 to 0.75 mg twice a day. (C) The clinically observed and in silico prediction of QT intervals over a wide range of preceding RR intervals after 2.72 ng/mL dofetilide application. Rate dependent changes in the QT interval were tracked as the slope of the linear regression line estimating the QT – relation. (D) Model predicted ΔQTC intervals with 2.5 mg/L moxifloxacin application (blue asterisks). Color symbols with error bars: clinical data after 400 mg moxifloxacin oral dose (maximum concentration Cmax is between 2.3 to 3.7 mg/L).59–65

