
Figure 1. Identification of isolated lymphoid follicles in human intestine.
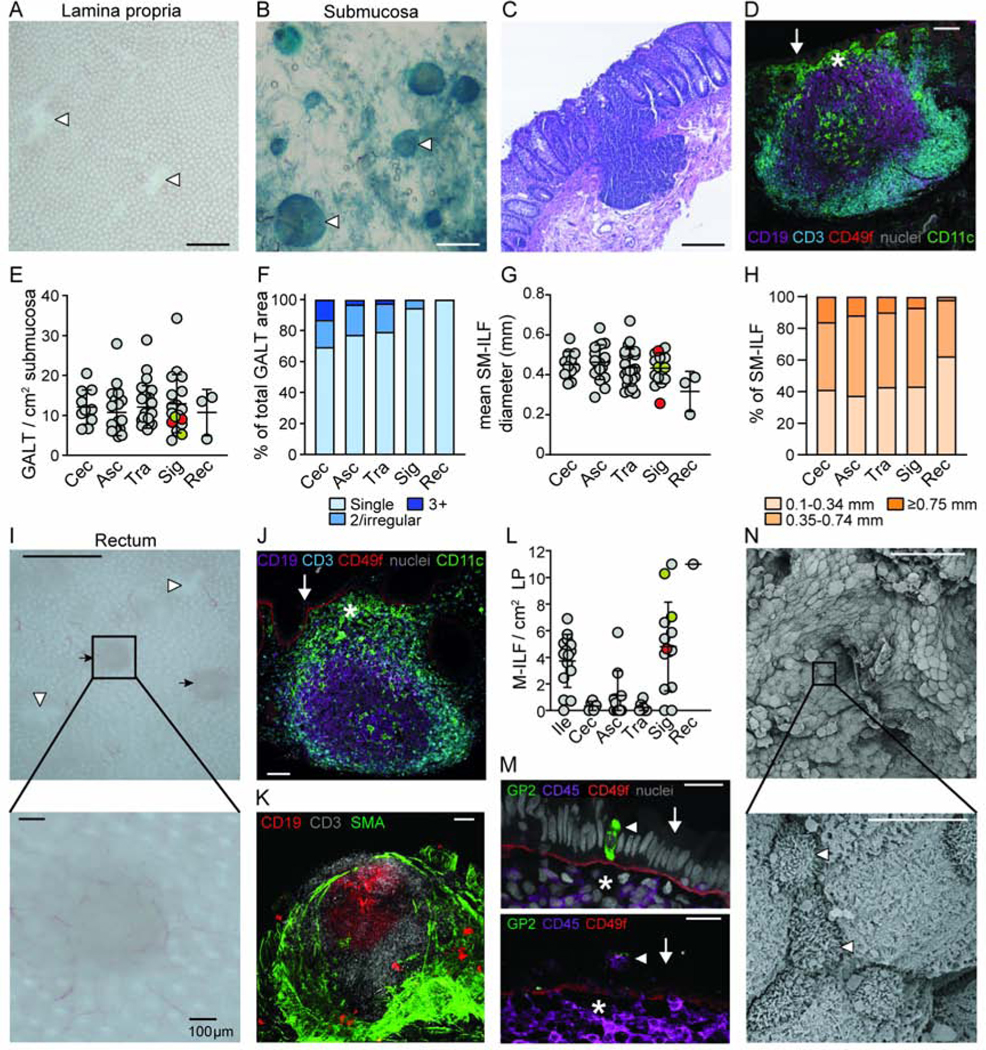
(A) Mucosal tissue showing holes (white arrow heads) in the colon LP after removal of SM. Scale bar, 1mm. (B) Lymphoid follicles (white arrow heads) were identified in the SM after counterstaining with methylene blue. Scale bar, 1mm. (C) H&E and (D) immunofluorescence analysis of SM follicles of full-thickness colon sections. Scale bar, (C) 200μm and (D) 100μm. (D) SM follicles comprise a central follicle of CD19+ B cells (purple) surrounded by CD3+ T cells (blue), a sub-epithelial dome (SED, star) containing CD11c+ cells (green) and an overlying CD49f+ epithelial basement membrane (red). Arrow indicates epithelium. Grey, nuclei stain. (E) Quantification of SM-GALT in indicated tissue. Each dot represents the mean number of GALT from a single patient, based on at least 2.5 cm2 of SM. Grey circles, uninvolved colorectal cancer, red circles, volvulus and orange circles, diverticulitis patients. Bars, mean ± 1SD. (F) Percentage of total GALT surface covered by the different kinds of GALT structures. Mean of 3–15 patients per site. (G) Diameter of SM-ILF within indicated tissue. Each dot represents the mean SM-ILF diameter from a single patient based on at least 2.5 cm2 of SM. Grey circles, uninvolved colorectal cancer, red circles, volvulus and orange circles, diverticulitis patients. Bars, mean ± 1SD. (H) Size distribution of SM-ILF within indicated tissue. Mean of 3–15 patients per site. (I) Mucosa after removal of SM showing the presence of M-ILF (black arrows) and holes left behind by SM-ILF (white arrow heads). Scale bar, 1mm (upper panel) and 100μm (lower panel). (J and K) Immunofluorescence staining of full-thickness sigmoid colon tissue showed M-ILF to contain a central follicle containing CD19+ B cells (purple) surrounded by CD3+ T cells (blue), a SED (star) containing CD11c+ cells (green) and overlying CD49f+ epithelial basement membrane (red). Grey, nuclei stain. Arrow indicates epithelium. Scale bar, 100μm. (K) M-ILF do not penetrate the smooth muscle actin (SMA) expressing muscularis mucosa. (L) Quantification of M-ILF in indicated tissues. Each dot represents the mean number of M-ILF from a single patient based on at least 2.5 cm2 of peeled LP. Grey circles, uninvolved colorectal cancer, red circles, volvulus and orange circles, diverticulitis patients. Bars, mean ± 1SD. (M) The follicle associated epithelium (FAE, arrow) of M-ILF showing a CD45+ lymphocyte filled pockets (lower panel, arrow head) and GP-2 expressing M cells (upper panel, arrow head). Scale bar, 20μm (upper panel) and 40μm (lower panel). Representative images of at least 3 donors. Star depicts SED. Grey, nuclei stain. (N) Scanning electron micrographs depicting cells with M-cell like morphology (white arrow heads) in the FAE of SM-ILF. Scale bar, 50μm (upper panel) and 5μm (lower panel). Representative images of 3 patients. Cec, caecum; Asc, ascending colon; Tra, transverse colon; Sig, sigmoid colon; Rec, rectum. See also Figure S1.