
Figure 2. The T cell composition of human ILF indicates they function as adaptive immune inductive sites.
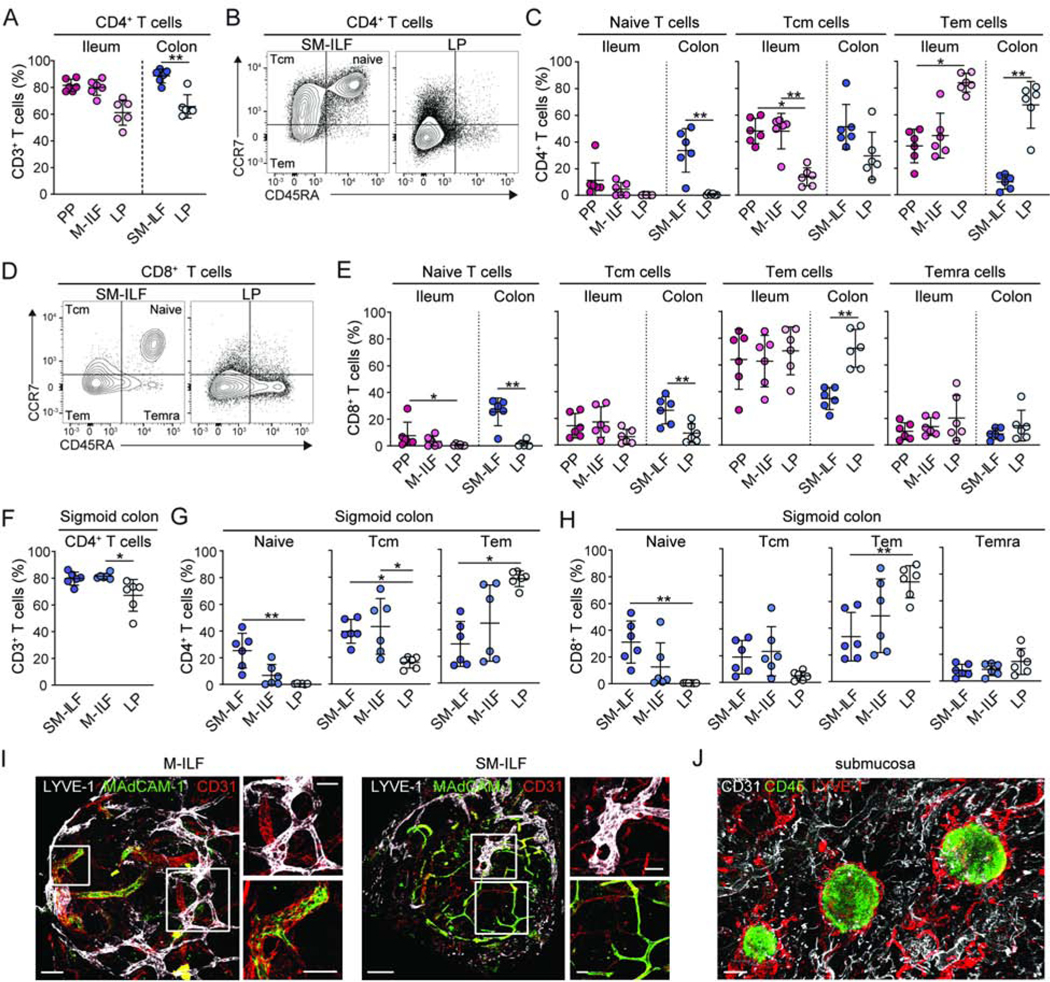
(A–E) T cell populations in single-cell suspensions of indicated paired tissues from right-sided hemi-colectomy resections were analyzed by flow cytometry. (A) CD4+ T cell frequency among CD3+ T cells from indicated compartments. (B, C) Representative gating (B) and quantification (C) of naïve, central memory (Tcm) and effector or effector memory (Tem) CD4+ T cells in indicated compartments. (D–E) Representative gating (D) and quantification (E) of naïve, Tcm, Tem and CD45RA+effector memory (Temra) CD8+ T cells in indicated compartments. (F) CD4+ T cell frequency of total CD3+ T cells, (G) CD4+ T cell and (H) CD8+ T cell composition of indicated compartments in the sigmoid colon. (A-H) PP, Peyer’s patch; SM-ILF, submucosal follicle; M-ILF, mucosal follicle; LP, lamina propria. Each circle represents an individual donor, matched between each of the sites, with SM-ILF and M-ILF data from at least 5 pooled follicles. Bars, mean ± 1SD. Statistical significance between paired samples was determined using the paired Friedman test with Dunn’s multiple comparisons *p<0.05, **p<0.01, ***p<0.001. (I and J) Immunofluorescence staining of (I) SM-ILF and M-ILF and (J) whole-mount SM. (I) LYVE-1+ lymphatics (white) and MAdCAM-1+CD31+ vascular endothelial cells (green). Scale bar, 100μm (M-ILF, left panel), 200μm (SM-ILF, left panel) and 50μm (right panels). (J) CD45+ cells (green), LYVE-1+ lymphatics (red) CD31+ endothelial cells (white). Scale bar, 300μm. Representative images from at least 3 donors. See also Figure S2.