
Figure 3. Antigen experienced CD4+ T cells in GALT and LP are functionally distinct.
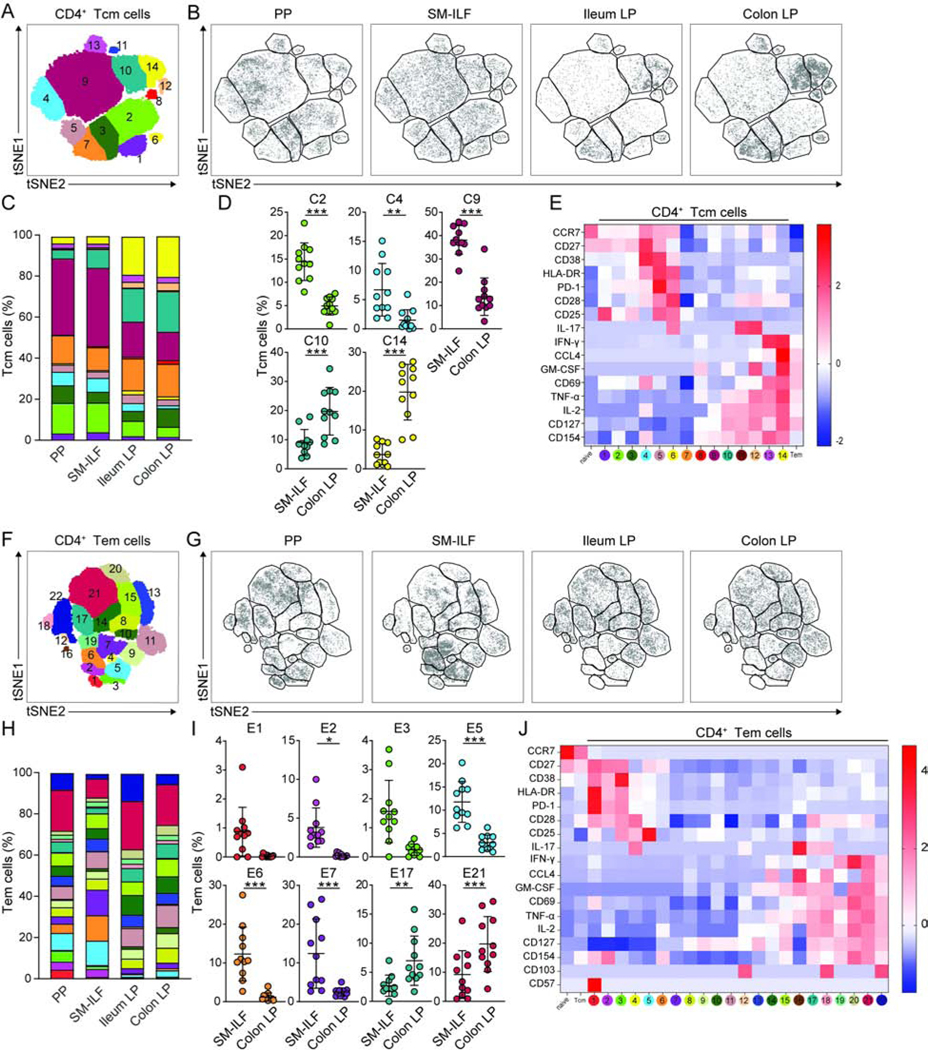
(A–K) Cell suspensions from indicated tissues were stimulated with PMA and ionomycin and analyzed by CyTOF. (A and F) 2D tSNE plots of total (A) CD45RA−CCR7+ CD4+ Tcm cells and (F) CD45RA−CCR7− effector or effector memory CD4+ Tem cells. (B and G) 2D tSNE plots of (B) Tcm and (G) Tem cells within indicated immune niche. Data are concatenated from 6–11 patients. (C and H) Bar charts showing mean cluster frequencies of (C) Tcm and (H) Tem cells. (D and I) Frequency of (D) Tcm and (I) Tem cell clusters within SM-ILF and colon LP. Clusters showing differences between sites are shown. Each circle represents an individual donor with samples paired from 11 patients; SM-ILF data is from at least 20 pooled follicles per patient. Bars, mean ± 1SD. (E and J) Heatmaps of (C) Tcm and (H) Tem cell cluster phenotypes showing Z-score of intensity of each marker, normalized by row. MFI of total naïve and Tcm or Tem cell populations is included for comparison. PP, Peyer’s patch; SM-ILF, submucosal isolated lymphoid follicle; LP, lamina propria. Statistical significance was determined using paired 2-way ANOVA, false discovery rate was corrected with the twostage step-up method of Benjamini, Krieger and Yekutieli, *p<0.05, **p<0.01, ***p<0.001. See also Figure S3.