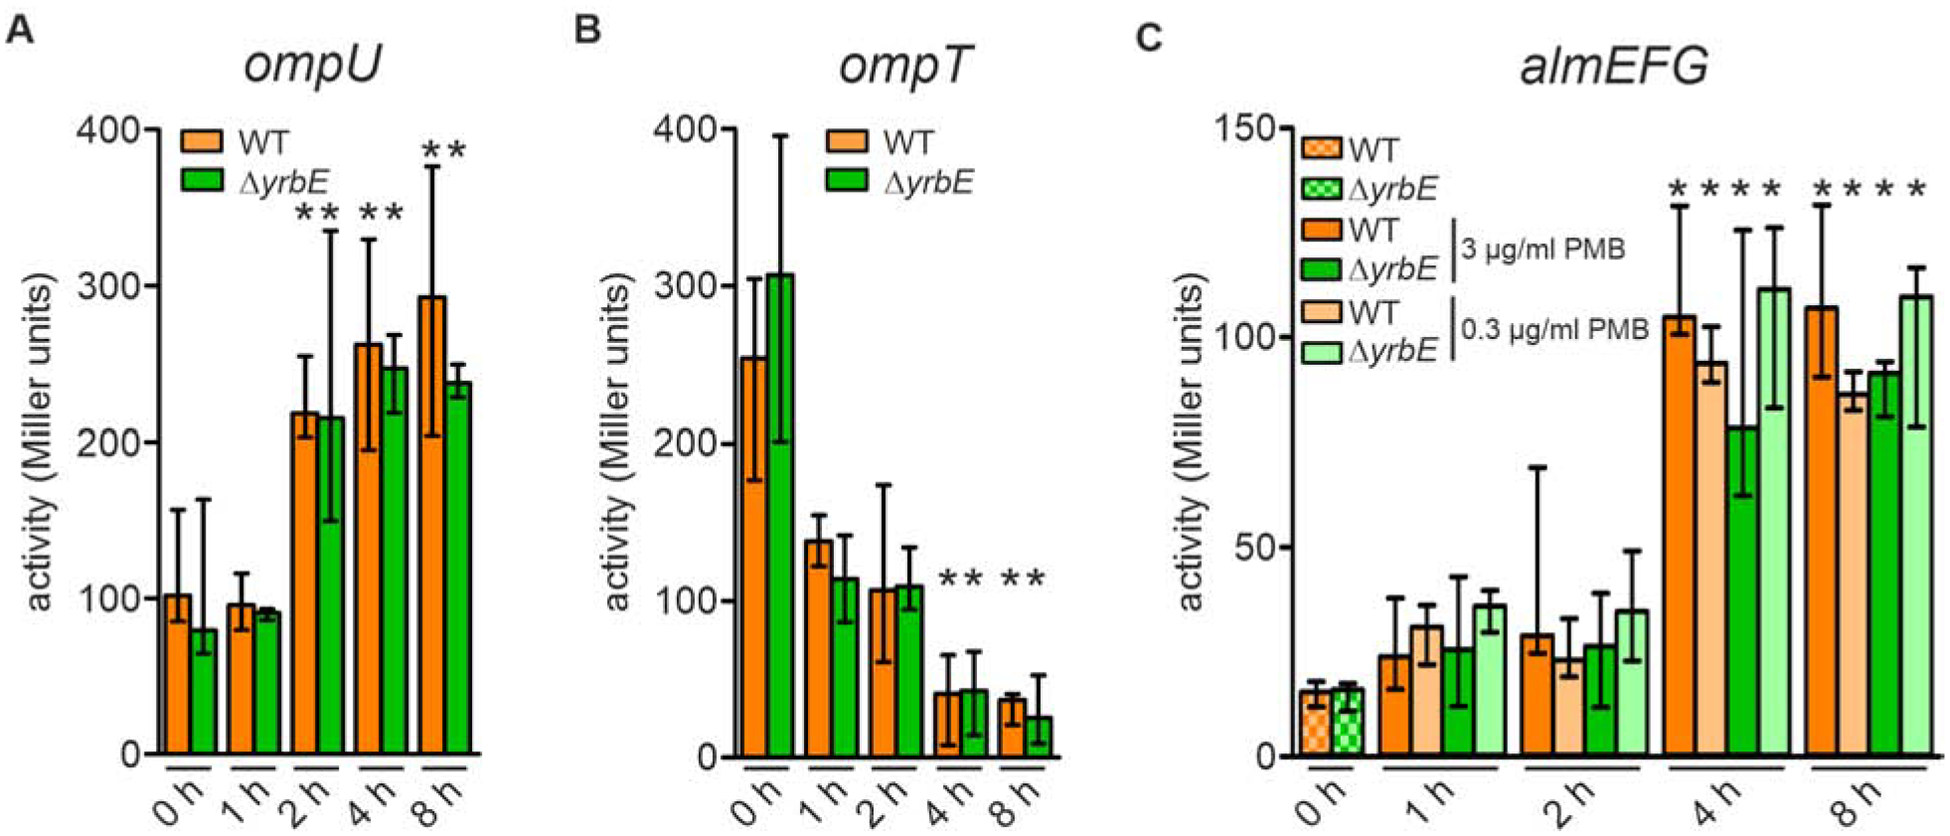
Figure 2. Differential expression of almG, ompU, ompT in a transition from minimal media M9 to M9ToxR↑ or M9ToxR↑/Alm↑.

(A and B) Alkaline phosphatase activities of WT and ΔyrbE harboring an ompU-phoA transcriptional fusion (A) and ompT-phoA transcriptional fusion (B) in M9 (0 h) as well as 1, 2, 4 and 8 h after transition to M9ToxR↑. Data presented are median ± IQR with the following number of biological replicates: in case of ompU-phoA (A) n = 17 for WT at 0 h; n = 10 for ΔyrbE at 0 h; n = 4 for WT at 1, 2, 4, and 8 h; n = 6 for ΔyrbE at 1, 2, 4, and 8 h; in case of ompT-phoA (B) n = 9 for WT and ΔyrbE at 0 h; n = 6 for WT and ΔyrbE at 1 h; n = 4 for WT and ΔyrbE at 2, 4, and 8 h.
(C) Alkaline phosphatase activities of WT and ΔyrbE harboring an almG-phoA transcriptional fusion in M9 as well as 1, 2, 4 and 8 h after transition to M9ToxR↑/Alm↑ (including either 3 μg/ml or 0.3 μg/ml final PMB concentrations as indicated). Data presented are median ± IQR with the following number of biological replicates: n = 4 for WT (0 and 2 h with 3 μg/ml PMB) and ΔyrbE (0 h); n = 8 for WT (1 and 4 h with both PMB concentrations, 8 h with 0.3 μg/ml PMB) and ΔyrbE (1 h with both PMB concentrations, 4 and 8 h with 0.3 μg/ml PMB); n = 5 for WT (8 h with 3 μg/ml PMB); n = 6 for WT (2 h with 0.3 μg/ml PMB) and ΔyrbE (2 h with 0.3 μg/ml PMB, 4 and 8 h with 3 μg/ml PMB).
(A to C) Significant differences along the transition (1 – 8 h) to the respective 0 h time points are indicated by an asterisk (*P < 0.05).
