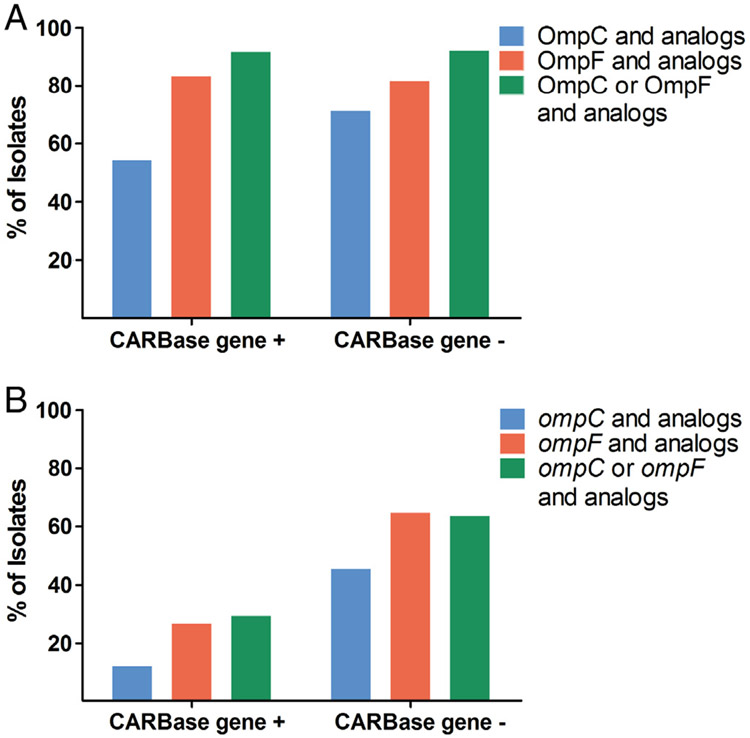
Fig. 2.
Porin protein and mRNA levels in CRE isolates with and without a carbapenemase gene. Bars show percentage of carbapenemase gene-positive (CARBase gene +) and gene-negative (CARBase gene−) CRE isolates with relative protein (A) and porin mRNA (B) down 2-fold or more compared with susceptible isolates.

