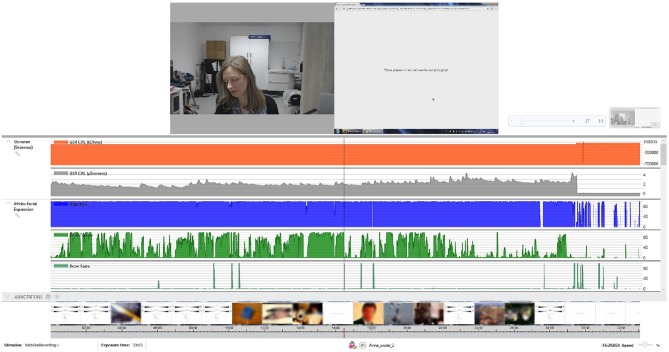
Figure 6.
Overview of the study protocol. The top row shows the participant together with the facial landmark points assigned by the iMotions facial recognition algorithm and a screen with instructions. The middle row shows the GSR and the Affdex Facial expression metrics. The bottom row shows in a timeline the response of the participant per image, and the Affective Slider, which, as can be seen in Figure 1, measures arousal (top) and pleasure (bottom) on a continuous scale. Due to copyright issues associated with the IAPS images, all images at the bottom have been blurred.

