Fig. 2.

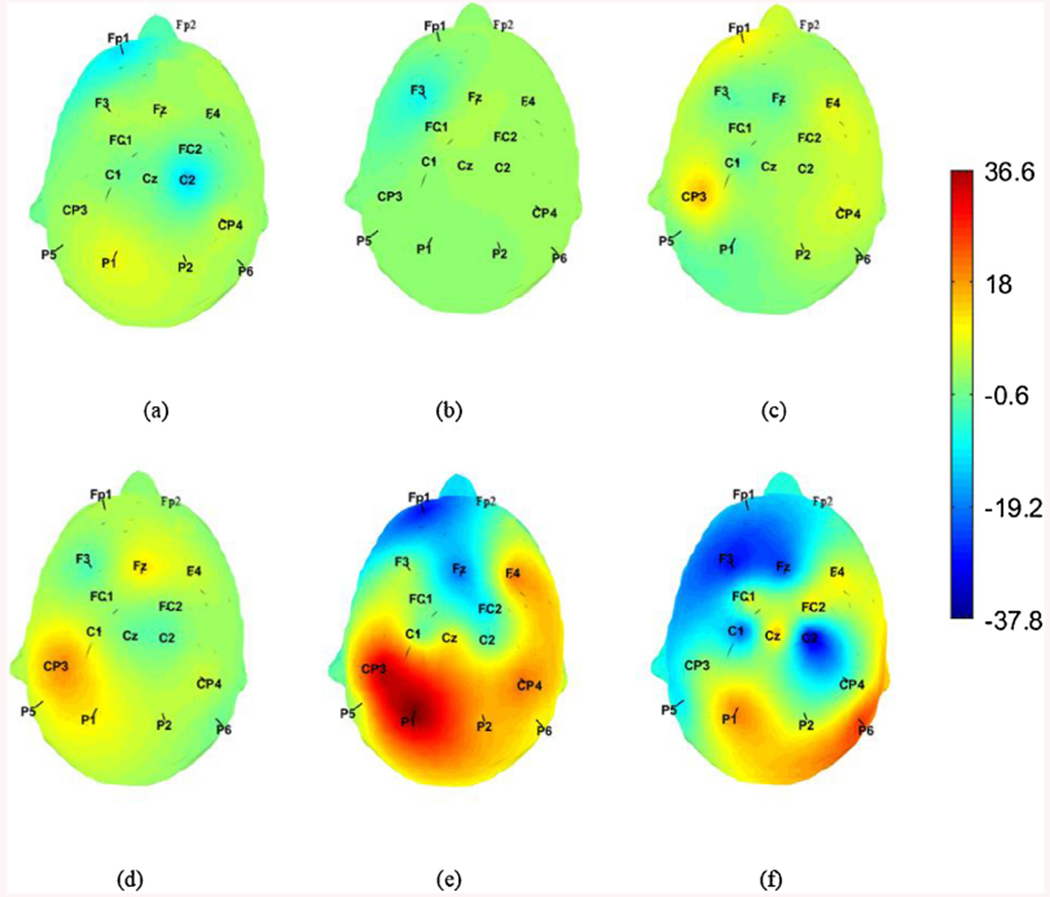
Heat map for the p values of the center procedure divided by the P values for the right center one at each electrode location for a) , b) , c) , d) , e) f) . All ratios were logarithmically scaled before plotting.

Heat map for the p values of the center procedure divided by the P values for the right center one at each electrode location for a) , b) , c) , d) , e) f) . All ratios were logarithmically scaled before plotting.