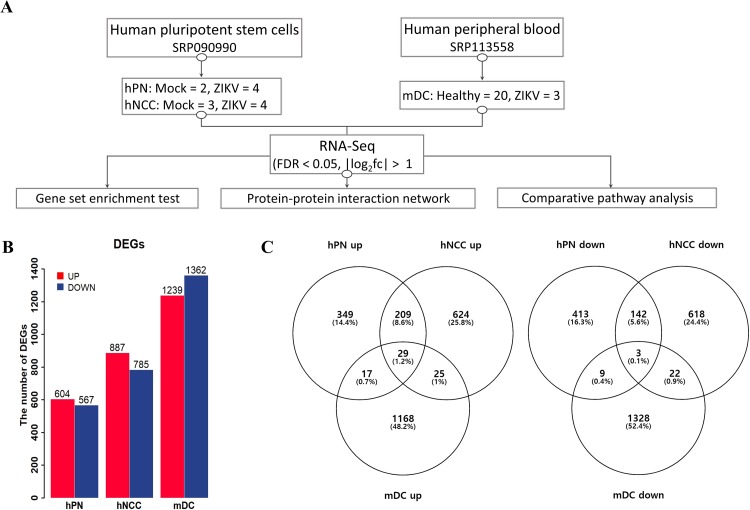
Fig 1. Comparison of cell-specific gene expression between ZIKV-infected cells and uninfected cells.
(A) Simple schematic for the three integrated datasets, including three different cell types (hPNs, hNCCs, mDCs). (B) Histogram demonstrating the numbers of DEGs in hPNs, hNCCs, and mDCs. (C) Venn diagrams showing overlap in the number of up- or downregulated DEGs for the three cell types. hPNs: human peripheral neurons, hNCCs: human neural crest cells, mDCs: myeloid dendritic cells.

