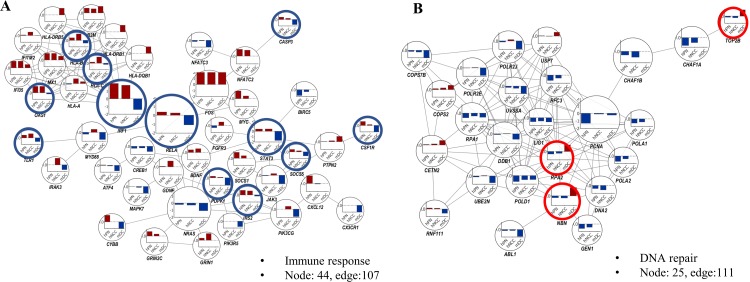
Fig 4. Comparative subnetwork with DEGs and fold-changes in hPNs, hNCCs, and mDCs.
(A) The 107 protein interactions of 44 DEGs in cytokine-mediated signaling pathway. (B) The 111 protein interactions of 25 DEGs in DNA repair system. The bar charts in node show the fold-changes in hPNs (left bar), hNCCs (middle bar), and mDCs (right bar) infected with ZIKV. Fold-changes were calculated using log2 (fold-change). Red circle: genes that are upregulated in mDCs as opposed to hPNs and hNCCs; blue circle: genes that are downregulated in mDCs as opposed to hPNs and hNCCs.

