
Fig 2.
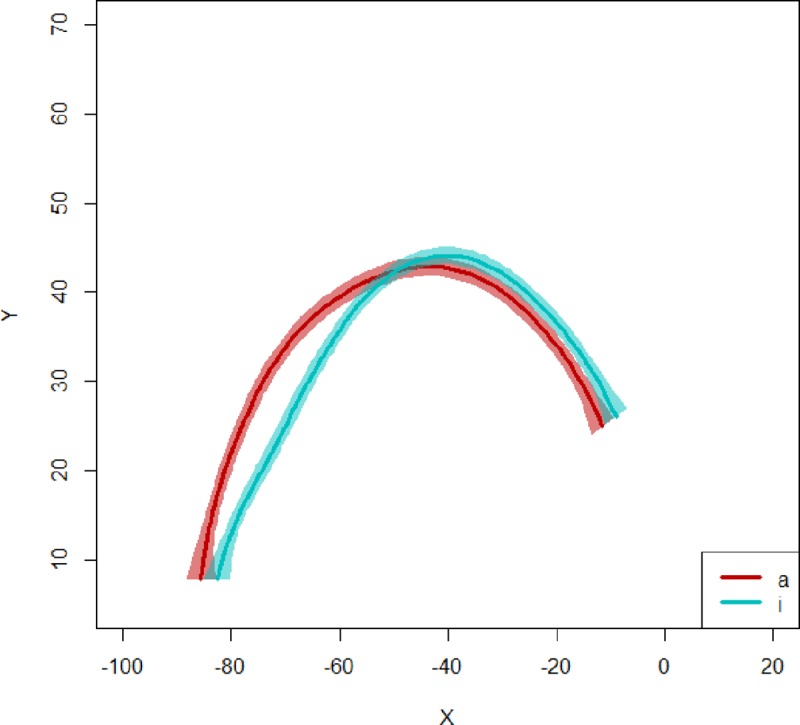
Illustration of average splines corresponding to midsagittal tongue contours with 95% confidence intervals, for a child participant, for /ε/ in /εbi/ (blue) and in /εba/ (red). X and Y are in mm.
Official websites use .gov
A
.gov website belongs to an official
government organization in the United States.
Secure .gov websites use HTTPS
A lock (
) or https:// means you've safely
connected to the .gov website. Share sensitive
information only on official, secure websites.
Illustration of average splines corresponding to midsagittal tongue contours with 95% confidence intervals, for a child participant, for /ε/ in /εbi/ (blue) and in /εba/ (red). X and Y are in mm.