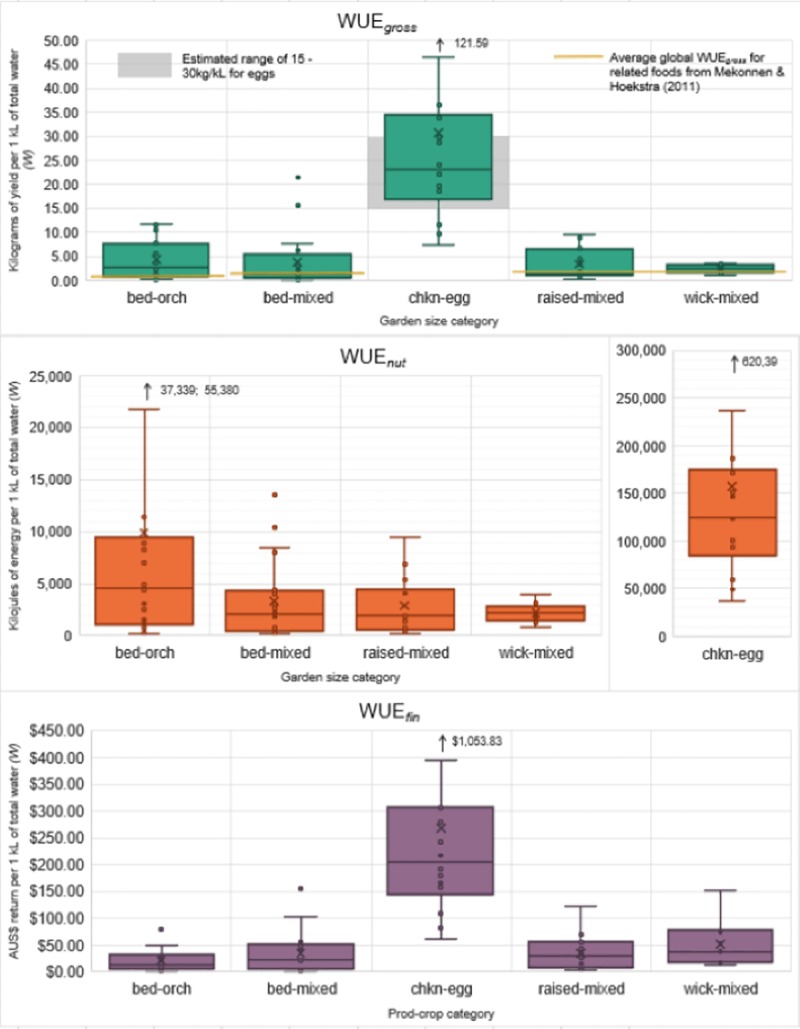
Fig 5. A comparison of the WUEgross, WUEnut and WUEfin scores for each of the five main method-crop categories.

Outliers are identified by the arrows, and the chkn-egg WUEnut scores required its own axis. The additional yellow lines on the WUEgross chart represent comparative WUE values of related foods from Mekonnen and Hoekstra [36]. The grey band represents the estimated WUEgross range for chicken eggs (irrigation only) as based on a brief review of online poultry keeping websites.
