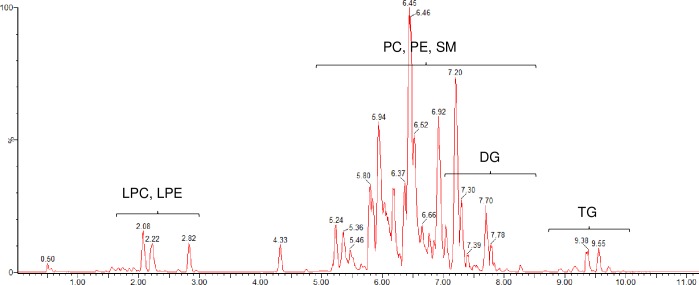
Fig 1. Base peak intensity UPLC-QTOF-MS chromatogram of a QC sample.
Retention time windows (min) for investigated lipid subclasses. Positive ionization mode. Time (min) is shown on x-axis and % of the highest peak on y-axis. Peak annotation: LPC–lysophosphatidylcholines, LPE–lysophosphatidylethanolamines, PC–phosphatidylcholines, PE–phosphatidylethanolamines, SM–sphingomyelins, DG–diacylglycerols, TG–triacylglycerols.

