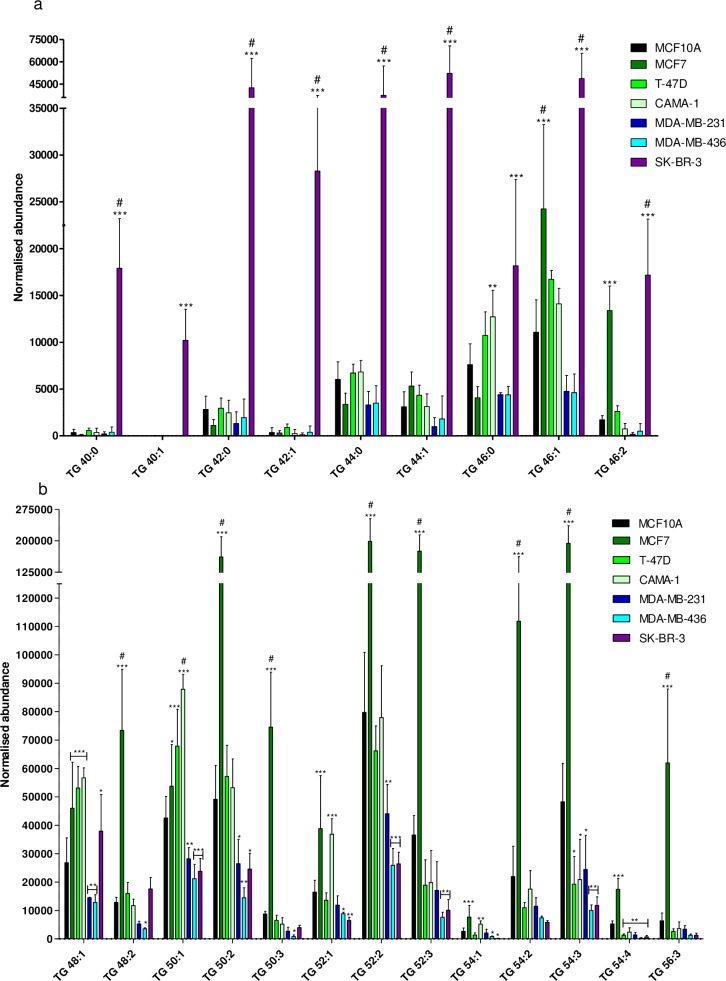
Fig 5. Normalized abundance of selected triacylglycerols (TG).
a) C-40 to C-46 TG and b) C-48 to C-56 TG. Bars represent mean abundance of three biological replicates, error bars represent standard deviation (SD). The normalized abundance is shown on the y-axis. Statistically significant increase of TG normalized abundance compared to MCF10A is indicated by * (p< 0.05), ** (p<0.01), *** (p<0.001), insignificant changes are unmarked. # indicates significant up-regulation after adjusting for multiple testing using two-way ANOVA followed by Bonferroni correction (p<0.05).

