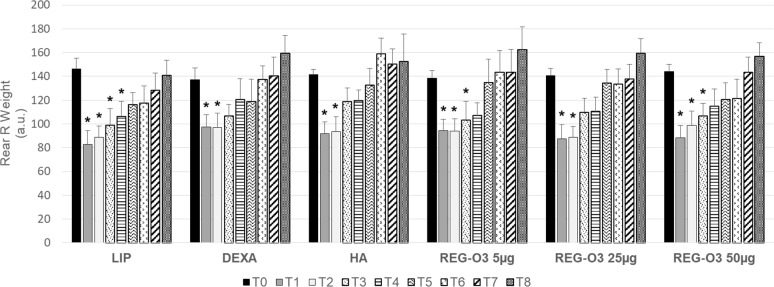
Fig 3. Evolution of the operated rear right pain/joint function measured by dynamic weight bearing test.
Evolution of rear right (R) weight bearing over time in all groups (n = 12/group). Results are presented as mean ± 95%CI at each time point (T corresponding to weeks after surgery) for each group (longitudinal analysis model for each group at each time point, *: p-value ≤0.0003 versus T0 was considered as significant).

