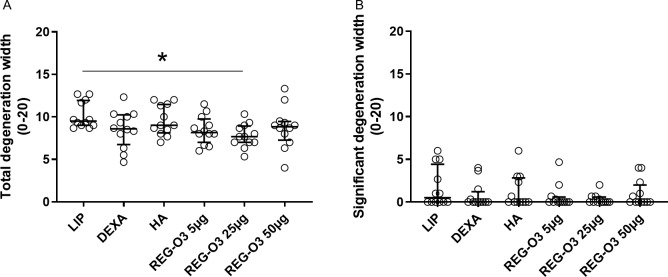
Fig 5. Cartilage degeneration width score.
(A) Total cartilage degeneration width for right knees from all study groups. Each dot represents the total cartilage degeneration width for one rat. Groups were compared to vehicle-treated rats (LIP) using non-parametric Kruskal-Wallis test. Since positive (p = 0.0241), it was followed by Dunn’s multiple comparisons test (*: p<0.05 versus LIP was considered as significant). (B) Significant cartilage degeneration width for right knees from all study groups. Each dot represents the significant degeneration width score for one rat. Groups were compared to LIP animals using non-parametric Kruskal-Wallis test which appeared negative (p = 0.7173). Data are presented as median (horizontal bar) and interquartile range (Q1–Q3; vertical bars). Open dots correspond to individual values.

