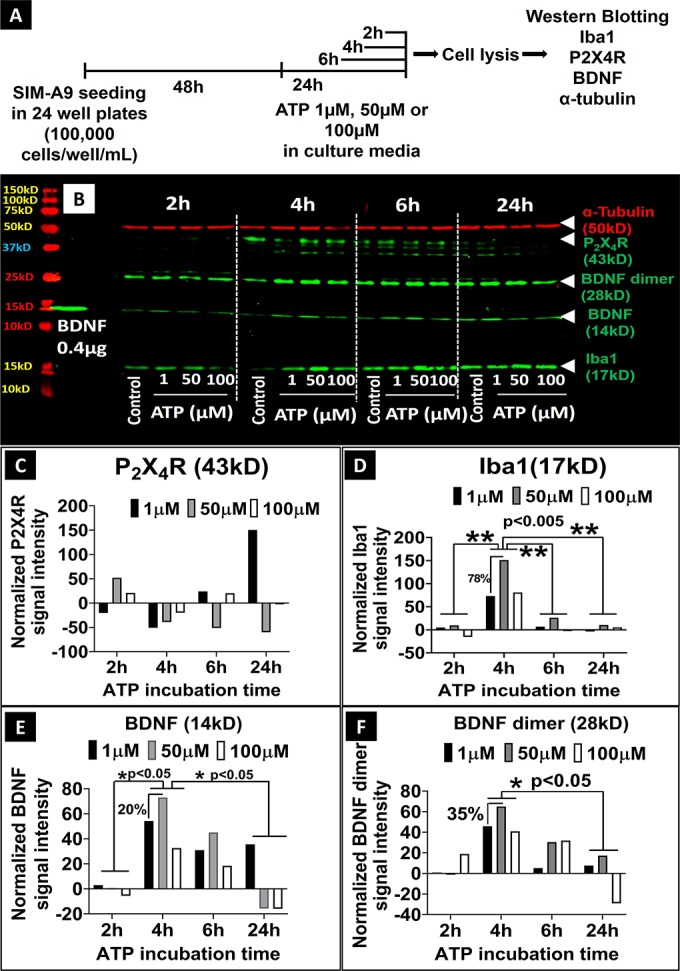
Fig 5. Effect of ATP on the expression of Iba1, P2X4R, BDNF, and α-tubulin proteins in SIM-A9 microglia cells analyzed using western blot.

A) SIM-A9 cells (P6) were cultured for 48 h and exposed to 1, 50, and 100 μM ATP for 2, 4, 6 and 24 h, then lysed immediately after the treatment for subsequent analysis. B) For P2X4R and BDNF evaluation, cell lysates were loaded at 50 μg in each lane, and the loading amount for Iba1 and α-tubulin was 30 μg/lane. Human recombinant BDNF protein (14 kD) was loaded at 0.4 μg/lane as a positive control. ATP concentration and time-dependent modulation of the levels of α-tubulin (50 kD, red), P2X4R (43 kD), BDNF (14 kD), BDNF dimer (28 kD) and Iba1 (17 kD) was studied after scanning the blots at 700 nm and 800 nm channels using Odyssey imager at intensity setting 5. C-F. Densitometry analysis of P2X4R, Iba1, BDNF, and BDNF dimer bands was performed using ImageStudio 5.2 software. Normalized signal intensity in Y-axis represents a normalization of protein signal intensity to, first, α-tubulin signal intensity followed by normalization to the signal intensity of control/untreated cells at each time point. Note: C-F demonstrates the quantification of the western blot shown in Fig 5B. It should be noted that the experiment was performed three independent times and the densitometry analysis for representative proteins, BDNF and Iba1, are shown in S12 Fig. Statistical analysis between specified groups was performed using GraphPad Prism 8.1.2. Asterisks indicate statistically significant differences (** p<0.005, * p<0.05). Blots were merged and cropped for the clarity and conciseness of the presentation. Full-length blots are presented in S13 Fig.
