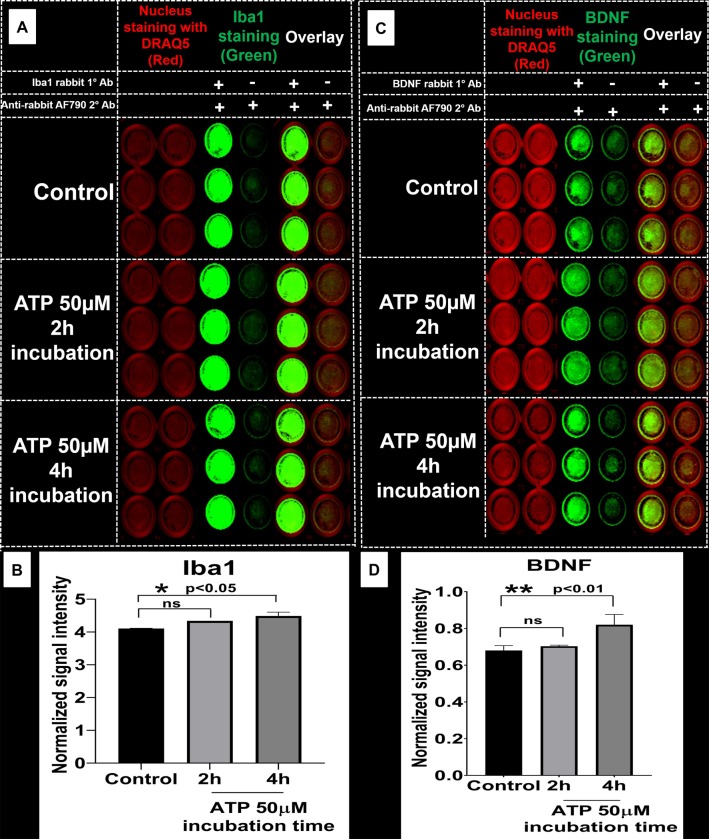
Fig 6. In-cell western analysis of the effect of ATP stimulation on Iba1 and BDNF expression.
A) SIM-A9 microglia cells (P8) were cultured for 48 h and exposed to 50 μM ATP for 2 and 4 h. Cells were fixed with 4% PFA, then treated with blocking solution and Iba1 protein was stained using rabbit Iba1 (1:500) and anti-rabbit AF790 (1:700, green). C) BDNF was stained using rabbit BDNF (1:500) and anti-rabbit AF790 (1:700, green). Nucleus was stained with DRAQ5 (red). Non-specific binding of secondary antibodies was accounted for by omitting primary antibodies in each group. B and D) Densitometry analysis of each plate (Iba1 and BDNF) was performed using ImageStudio 5.2 software. Normalized signal intensity in Y-axis represents the normalization of protein signal intensity to nuclear staining followed by subtraction of non-specific signal intensity (-/+, no 1°, only 2° Ab). Statistical analysis between specified groups was performed using GraphPad Prism 8.1.2. Asterisks represent statistically significant differences (* p<0.05). Data are presented as mean ± SD of n = 3 samples. ICW images of 96-well plates for each protein were merged and cropped for the clarity and conciseness of the presentation. Full-length blots are presented in S14 Fig.

