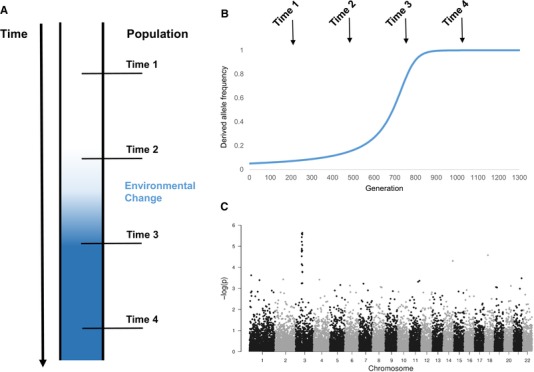
Figure 2.

Illustration of how to track genetic adaptation of a population to environmental change through time. (A) One way to catch genetic adaptation in the act is by sampling genetic data of a population before and after the introduction of a new selective pressure (time 2 and 3, respectively). (B) Conceptual illustration of how the frequency of an allele can change in response to a new selective pressure. (C) Significant changes in allele frequencies between different populations (i.e., at time 2 and 3) can be measured with a genome‐wide scan for selection (the figure was created using the gwasResults dataframe included in qqman package in R; Turner 2014).
