
Figure 4.
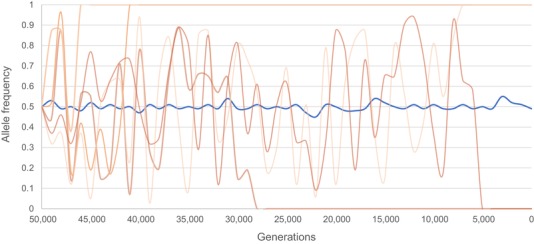
Illustrative scheme of differences in allele frequencies of an allele under balancing selection versus a neutral allele. An allele under balancing selection (shown in blue) will show small fluctuations around a 0.5 allele frequency. The frequencies of neutral alleles (shown in orange) will change following a more stochastic process, eventually leading to fixation or loss of the allele from the population.