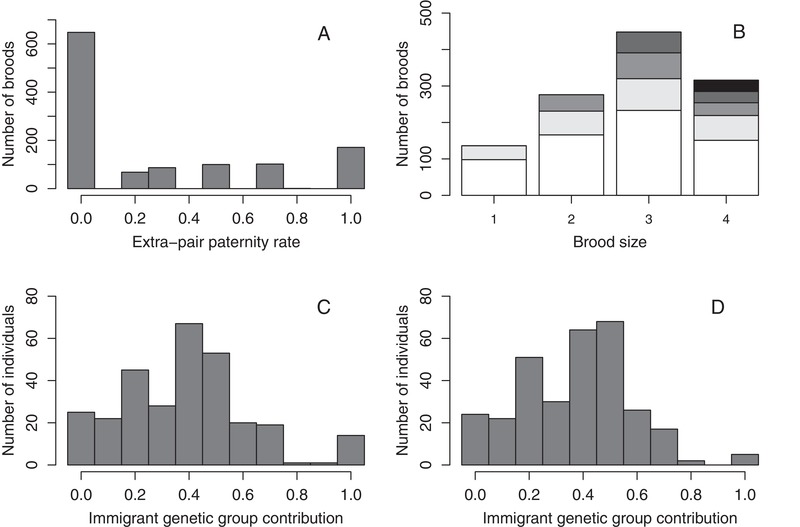
Figure 2.

Distributions of observed extra‐pair paternity rate shown as (A) a proportion (mean 0.288 ± 0.371 SD) and (B) a binomial trait as analyzed across 1177 observed song sparrow broods, and the expected immigrant genetic group contributions (q i) to (C) 295 phenotyped females (mean 0.39 ± 0.24 SD) and (D) 309 phenotyped males (mean 0.38 ± 0.20 SD). Mean contributions across 281 phenotyped females and 304 phenotyped males that hatched on Mandarte were 0.36 ± 0.20 SD and 0.37 ± 0.19 SD, respectively. In (B), black, dark gray, mid gray, light gray, and white denote broods that contained 4, 3, 2, 1, and 0 extra‐pair offspring, respectively, within each brood size. One brood of five offspring (four extra‐pair) is not depicted.
