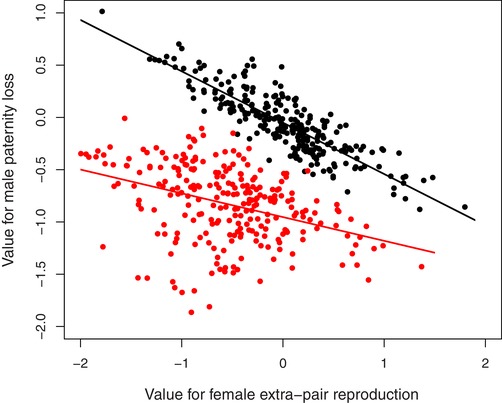
Figure 3.

Illustration of posterior mean predicted breeding values (a i, black) and total additive genetic values (u i, red) for female liability for extra‐pair reproduction and male liability for paternity loss across 252 song sparrows hatched during 2003–2012. Lines represent regressions of male liability on female liability and are intended to illustrate the cross‐sex genetic correlation in breeding value (black) versus total additive genetic value (red). Note that breeding values are deviations from defined group means.
