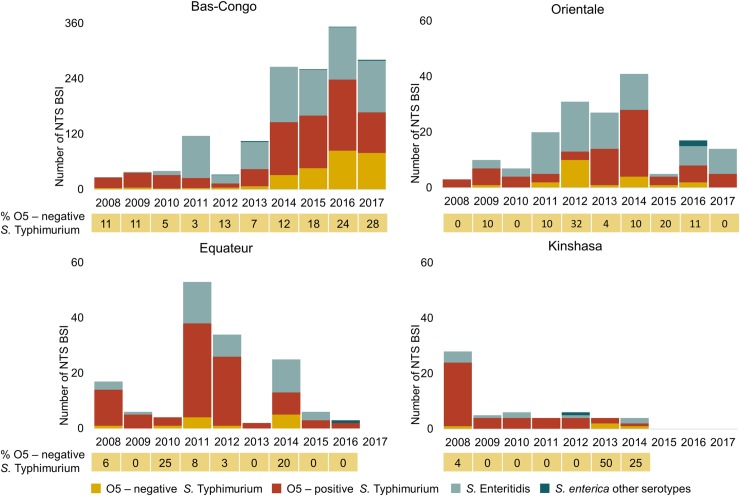
Fig 2. NTS-serotype distribution per year per province demonstrated variation of the predominant serotype over time and place and the emergence of O5-negative Salmonella Typhimurium.
Bars represent the number of NTS bloodstream infection (BSI). Data below the bars represent the annual proportion (%) of O5-negative Salmonella typhimurium among the total NTS BSI.

