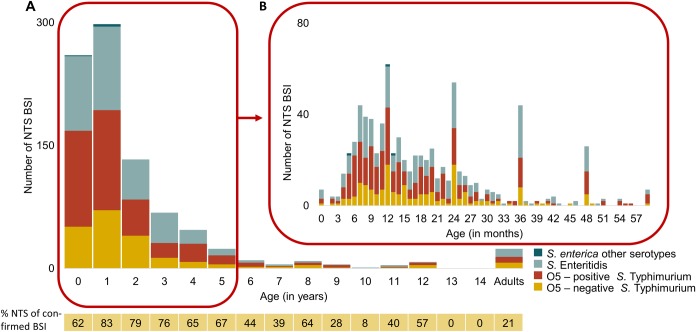
Fig 3. Age distribution of NTS bloodstream infections sampled at Kisantu general referral hospital from 2015–2017.
A: Bars represent the number of NTS bloodstream infection (BSI) per age (in years). The proportion (%) of confirmed BSI episodes caused by NTS in the respective age group is displayed below the graph. B: Bars represent the number of NTS BSI per age (in months). During this period, 806/896 NTS BSI were obtained from children < 5 years old. The exact age in months was available for 770/806 NTS BSI from children < 5 years old. Poor knowledge and registration of the exact age in months resulted in artificial peaks of NTS on multiples of 12 months. Abbreviations: BSI: bloodstream infection.

