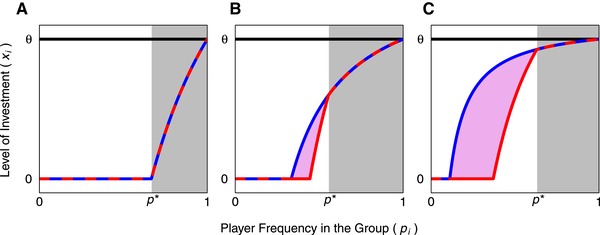
Figure 1.

The ESS patterns of investment by a player into public goods across frequencies () under different cost‐benefit scenarios. In each panel, the red line indicates the ESS for the focal player in groups composed of two players (i.e., when ) and the blue line the ESS for the focal player in groups that contain a large number of nonfocal players, each at low frequency. These lines overlap (indicated by the alternating red and blue dashed lines) when the focal players is at a frequency that is above the threshold p* (indicated by light‐gray shading), which is the frequency at which the focal player is the only contributor toward public goods. In regions where these two lines do not overlap, they set upper and lower limits to the expected level of investment (because players reduce investment in response to investment by others; groups with a large number of other players will set an upper limit on investment, whereas groups with two players set a lower limit on investment; see Eq. 6). The purple shaded area, therefore, indicates the range of possible patterns of investment by the focal player, with the exact value depending on the distribution of frequencies across nonfocal players within the group. The solid black horizontal line indicates the level of investment that maximizes group fitness (θ; Eq. 9). The three panels show patterns corresponding to different benefit‐to‐cost ratios (where costs were held constant at and benefits b were varied), which were chosen to capture three fundamental scenarios: (A) benefits relative to costs are low (), such that players only contribute when they have a high frequency and consequently there is only ever a single contributor, (B) benefits relative to costs are high () and consequently there is potentially a small overlap between conditions where the focal player contributes and nonfocal players might also contribute, and (C) benefits relative to costs are very high () and consequently there is a very large region where nonfocal players may be motivated to contribute.
