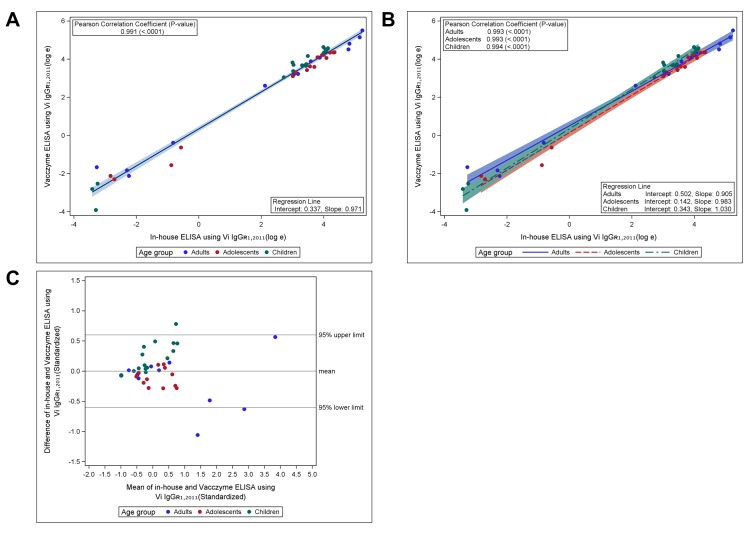
Fig 1. Correlation of serum anti-Vi IgG values determined with U.S. reference reagent Vi IgGR1, 2011 between in-house Vi-ELISA and Vacczyme ELISA.
Scatter plot and linear mean regression line with 95% confidence interval (A) overall and (B) by age group. Correlations between the assays were analyzed using Pearson correlation coefficient (P < 0.001). (C) Correlation between the assays according to Bland–Altman plot using standardized data.

