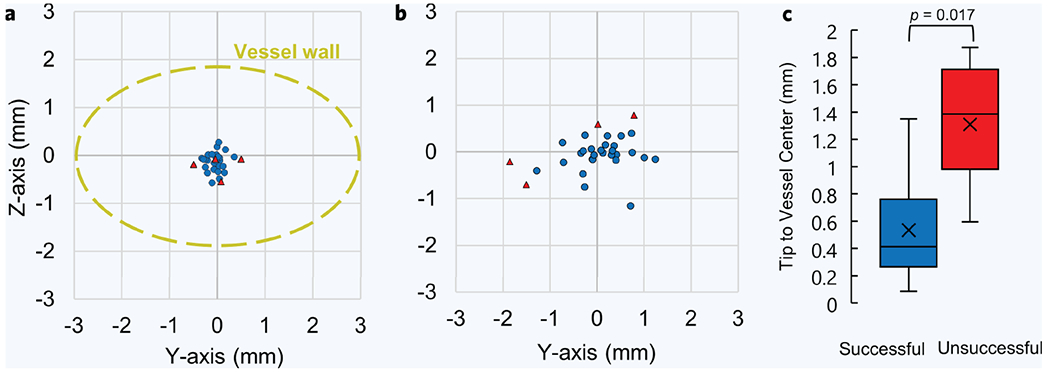
Figure 3. Needle tip placement accuracy and vessel sizes.

(a) Needle tip placement accuracy from all participants (n = 31). This is the difference between the desired and actual needle tip position after robotic insertion was completed, as determined from the ultrasound images. Blue points are the needle tip coordinates from successful cases and red are from unsuccessful cases. The Z-axis is the vessel depth and the Y-axis is the vessel sagittal position, as determined from the ultrasound images. Displayed in yellow is the average vessel size from all participants, which is shown for perspective. (b) Distances between the needle tip position and the vessel center, post-puncture. Needle tip and vessel center positions were obtained from ultrasound images, relative to the transducer head, during each venipuncture. (c) Distribution of differences between needle tip position and vessel center, post-puncture, between successful and unsuccessful venipunctures. P value was calculated using an unpaired nonparametric two-sided t-test.
