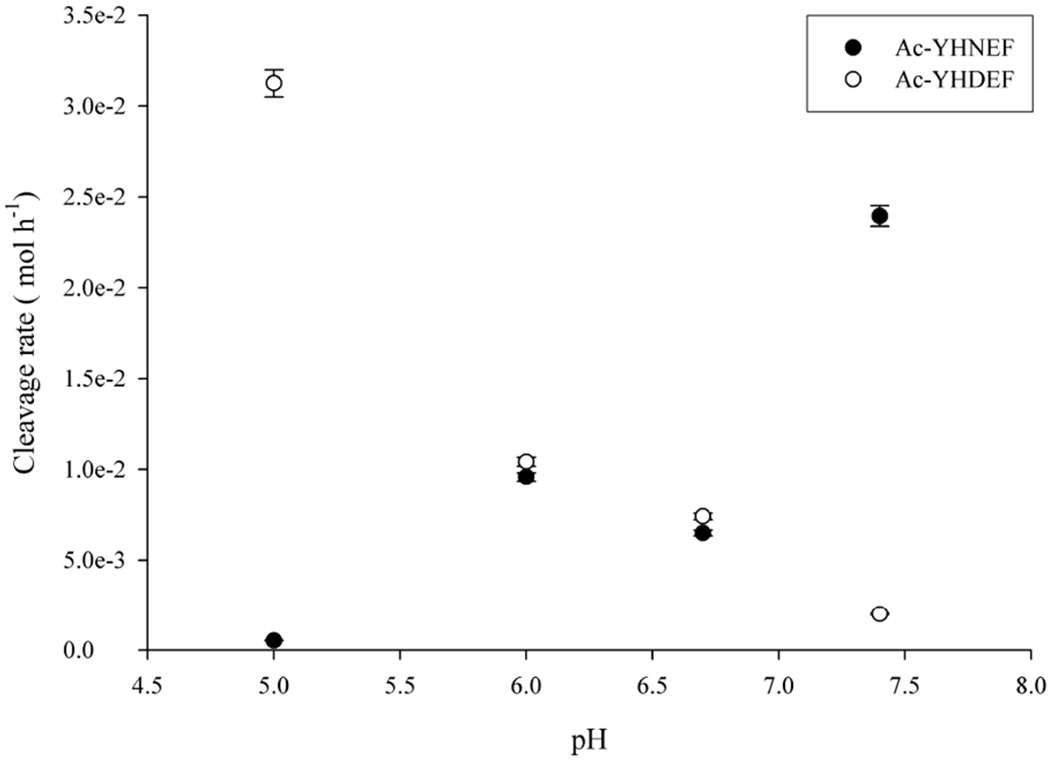
Figure 9. Cleavage at Asp compared with the rate of cleavage at Asn.

The rate of cleavage of Ac-YHNEF and Ac-YHDEF as a function of pH. Cleavage of Ac-YHNEF was calculated as the sum of the peak areas of Ac-YHD, Ac-YHD-amide, Ac-YHN, and Ac-YH(Asu) by comparison to the amount of original peptide injected on HPLC. Ac-YHDEF cleavage was calculated as above using only Ac-YHD peak area. Each time point n=3. All peak areas were calculated from absorbance at 280nm. Experiments were conducted in triplicate at 60°C.
