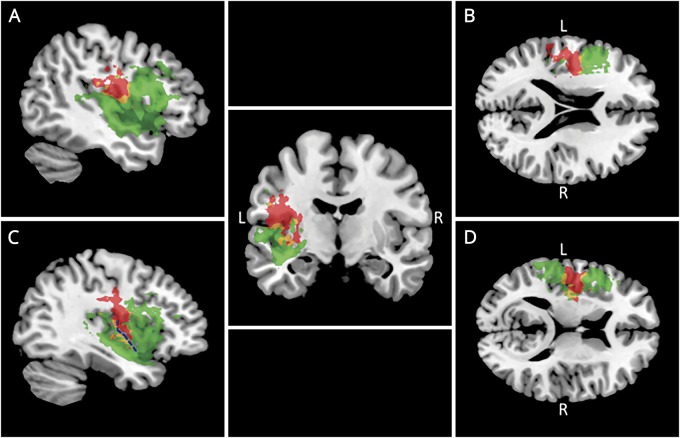
Figure 3. Left-hemisphere lesion location corresponding to AOS-specific ASRS and BNT-30 scores.
Red indicates lesion corresponding to the AOS-specific score from the apraxia of speech rating scale. Green: lesion corresponding to BNT-30 score. Yellow: overlap. Panels A through D depict different sagittal and axial slices, which show the lesion overlap on a canonical T1-weighted brain. The blue dotted line in the lower left section (C) indicates the central sulcus of the insula. AOS = apraxia of speech.

