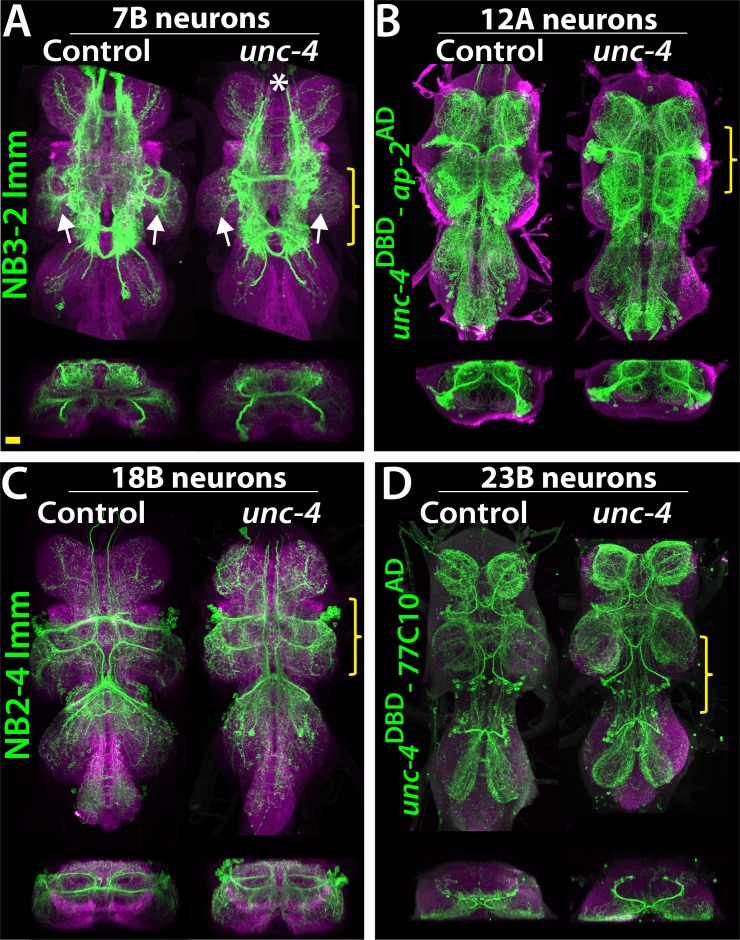
Figure 5. Projections of Unc-4+ lineages in control and unc-4 mutant backgrounds.
(A–D) VNC examples from control (left panels) and unc-4 mutant (right panels) adults. Transverse views from a 3D projection of the region indicated by yellow bracket are shown under the main images. (A) NB3-2 intersected reporter immortalization with ey-AD;dbxDBD driver was used to visualize the 7B neurons. In the unc-4 mutant animal, the 7B neurons did not innervate the T2 leg neuropil (compare the regions indicated by arrows). Note that 7B neurons in the mutant T1 segment were not labeled in this sample (asterisk), but in other mutant samples, projections of 7B neurons in T1 segments were similar to the control (not shown). (B) uncDBD- AP-2AD driver GFP used to mark 12A neurons. No dramatic difference was observed between the control and mutant VNCs. (C) Poxn-GAL4 driven reporter immortalization in NB2-4 used to visualize 18B neurons. Their neuronal projections appeared similar in the control and mutant. (D) unc-4DBD;77C10AD driven GFP expression used to visualize projections of 23B neurons, which did not differ between the control and mutant. Z projection images were made from a subset of confocal slices to visualize projections of all neurons. Scale bar is 20 microns.

