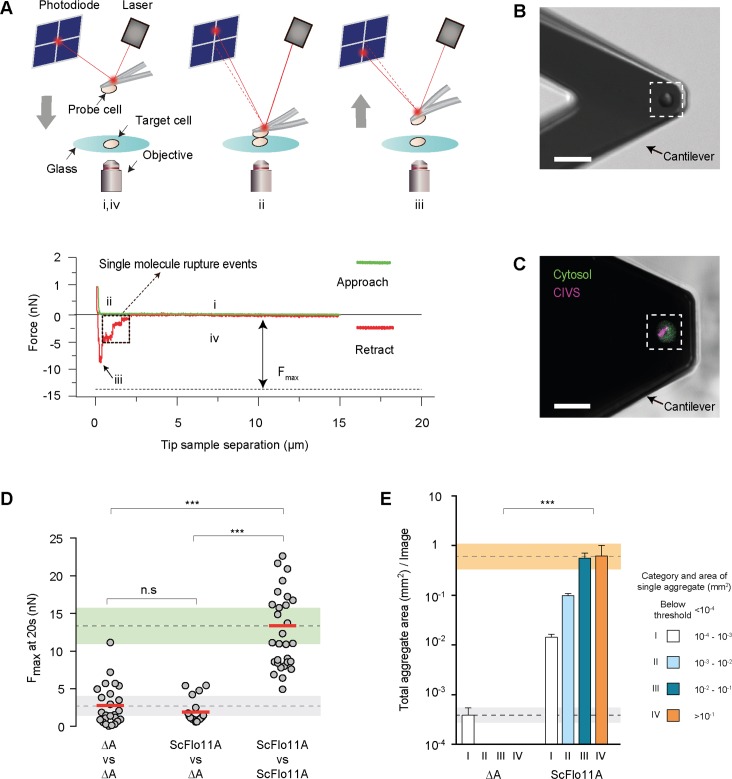
Figure 2. Quantification of Flo11-mediated cell adhesion forces.
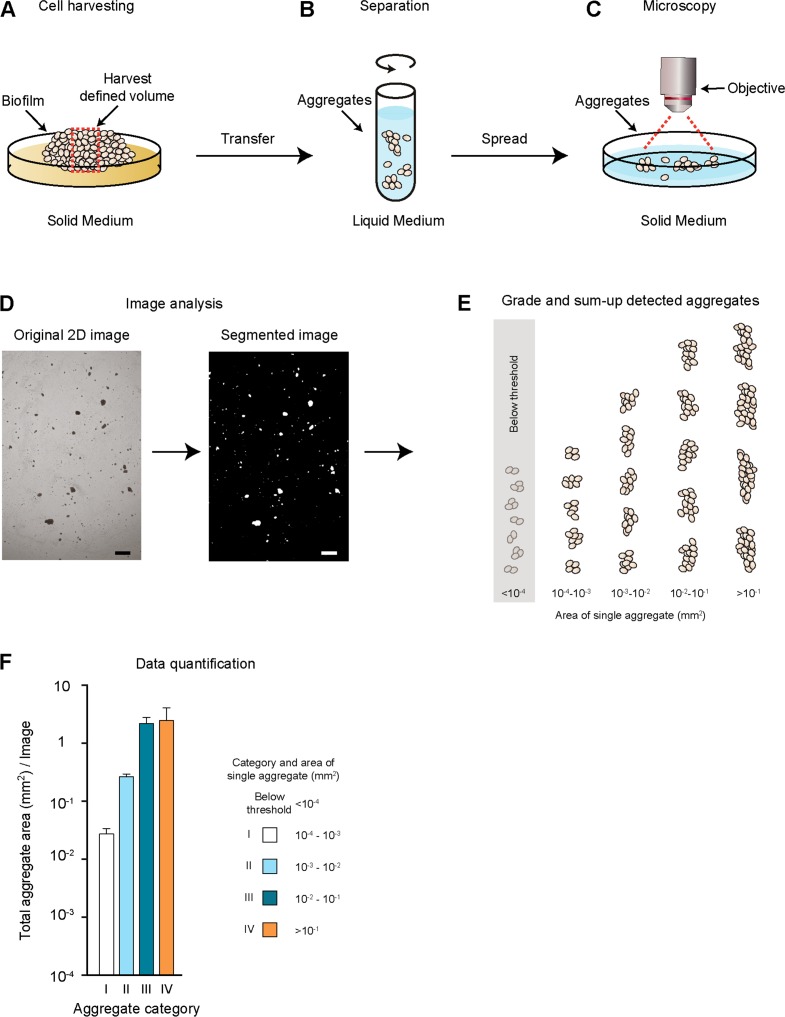
(A) Outline of a single-cell force spectroscopy (SCFS) experiment (upper scheme). (i) The probe cell is immobilized on an AFM cantilever and brought into contact at a defined speed with a target cell adhering to a glass substrate until a preset contact force is reached. After a defined contact time (ii), the cantilever is retracted until the probe cell is fully separated from the target cell (iii and iv). During approach and retraction, the cantilever deflection and thus, the force acting on the probe cell, is detected by using a laser and a photodiode and is recorded in a force-distance curve (lower scheme) that allows calculation of the maximum adhesion force (Fmax). (B) Single yeast probe cells immobilized on an AFM cantilever. The image was obtained by differential interference contrast imaging. Scale bar corresponds to 15 µm. (C) Confocal laser scan microscopy after staining with FUN-1 dye. Fungal cells internalize FUN-1 and the dye is seen as diffuse green cytosolic fluorescence. FUN-1 is then transported to the vacuole in metabolically active cells and subsequently compacted into fluorescent, red cylindrical intravacuolar structures (CIVS), here pseudo-colored in purple to indicate healthy cells (Millard et al., 1997). Scale bar corresponds to 15 µm (D) Adhesion forces mediated by ScFlo11A at single cell level were determined for homotypic or heterotypic interaction of yeast cells presenting no Flo11A (ΔA) or ScFlo11A by SCFS (Figure 2—source data 1). Average FMax values measured after 20 s of contact time are shown as red bars and were calculated from at least 15 independent individual measurements (grey dots). The average adhesion forces mediated by cells lacking ScFlo11A or with ScFlo11A are shown by dotted lines, and corresponding SD areas are shown by grey and green bands. (E) Cell-cell aggregation strength mediated by ScFlo11A in homogeneous populations was determined using yeast strains presenting no Flo11A (ΔA) or ScFlo11A by QCAM (Figure 2—figure supplement 4). Total area covered (mm2) by all cell aggregates of a given size category (I - IV) per image area (1 cm2) is shown as a quantitative measure for cell-cell aggregation. Error bars indicate standard deviation obtained by at least three independent measurements. The average total aggregate areas obtained with cells lacking Flo11A or with regular ScFlo11A are shown by dotted lines, and corresponding SD areas are shown by grey and orange bands. Significance was calculated applying an unpaired t-test (D) or a Wilcoxon rank sum test (E) with p>0.05 (n.s), 0.05 ≥ P > 0.01 (*), 0.01 ≥ P > 0.001 (**), p≤0.001 (***).

