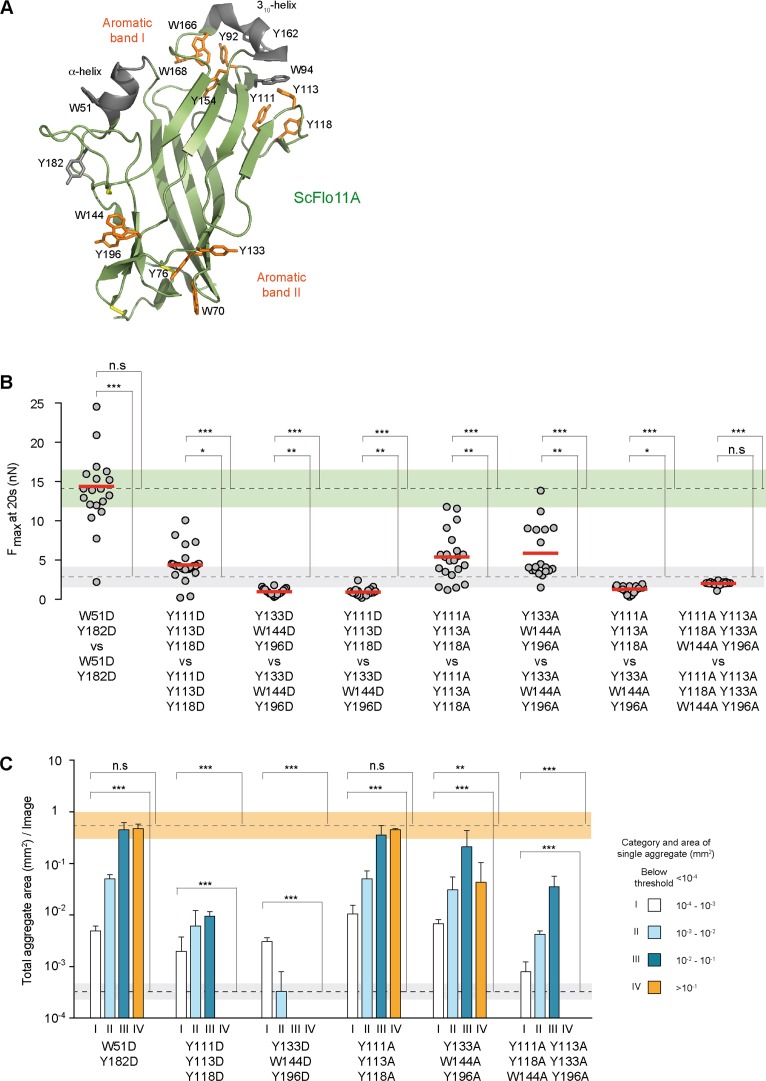
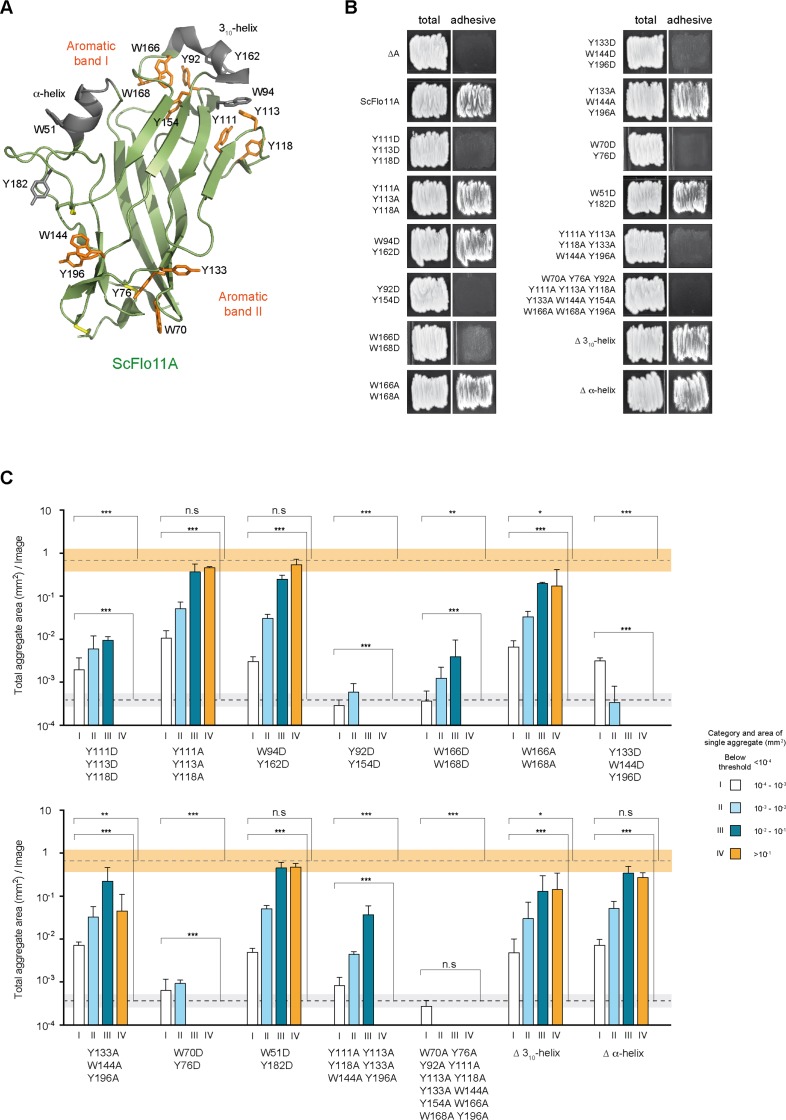
Figure 3. Functional mapping of the Flo11A protein surface at single cell and population level.
(A) Structural model of ScFlo11A (PDB code 4UYR). Functionally relevant aromatic surface residues of aromatic bands I and II are depicted in orange (as shown in Figure 3—figure supplement 1). Surface exposed aromatic residues and helices not required for cell-cell adhesion, are shown in grey. Disulfide bonds are shown in yellow. (B) Adhesion forces mediated by ScFlo11A mutants at single cell level were determined by SCFS (Figure 3—source data 1) as described in Figure 2D. Mutations of ScFlo11A are indicated. The average adhesion forces and SD areas mediated by cells with regular ScFlo11A or lacking ScFlo11A are indicated as green or grey bands. (C) Cell-cell aggregation strength mediated by ScFlo11A mutants in homogeneous populations was determined by QCAM as described in Figure 2E. Mutations of ScFlo11A are indicated and correspond to mutations measured by SCFS in b. The average total aggregate areas obtained by cells with regular ScFlo11A or lacking ScFlo11A are indicated as orange or grey bands. Significance was calculated as described in Figure 2.


