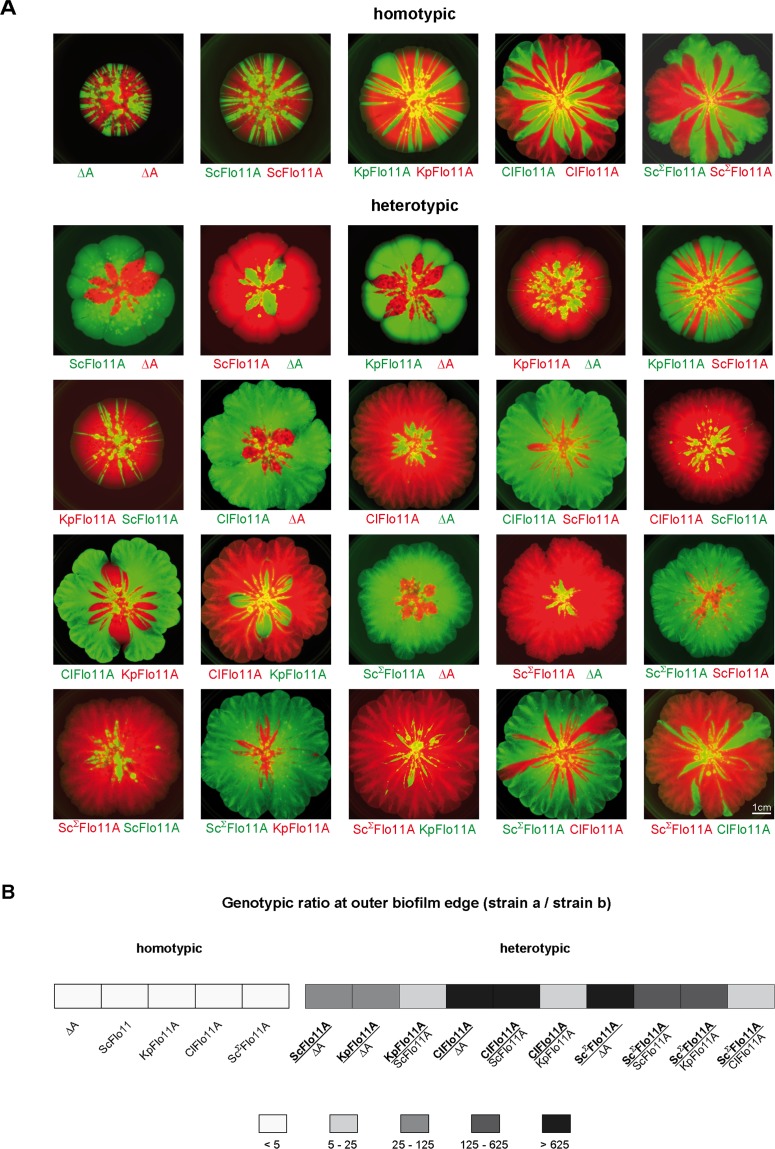
Figure 5. Flo11A-mediated separation of competitive yeast strains.
(A) Competitive biofilm assays. Yeast strains expressing the indicated Flo11 variants were mixed in a 1:1 ratio and were grown to a mat biofilm for three weeks. To distinguish between competing Flo11 variants, strains were tagged by expression of either GFP (green color) or RFP (red color). Homotypic and heterotypic Flo11 combinations are indicated. Each Flo11 variant was assayed using two independent strains tagged by either GFP or RFP, to test robustness to the fluorescence marker. Scale bar corresponds to 1 cm. (B) Quantification of presence of competing Flo11 strains from A present at the outer biofilm edge (Figure 5—source data 1). For quantification of the genotypic ratio, the amount of the signal produced by the superior strain a (bold) was divided by the amount of the signal from the inferior strain b (regular). Average ratios are presented using five different categories as indicated. For each combination of competing strains, at least two biological replicates of independently obtained clones were assayed.


