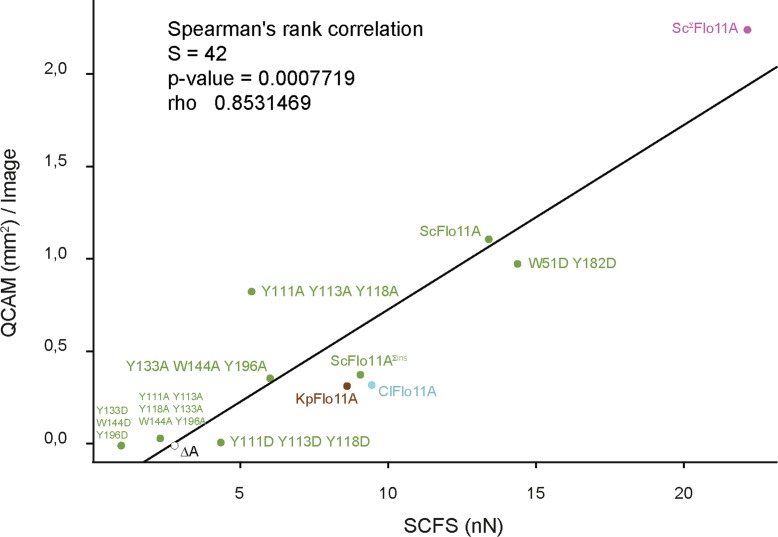
Figure 7. Correlation between SCFS and QCAM data.
Correlation between maximum adhesion forces obtained by SCFS analysis and total aggregate areas obtained by QCAM analysis was calculated by Spearman's rank correlation test. Dots show SCFS and QCAM data obtained for different Flo11A variants as indicated.

