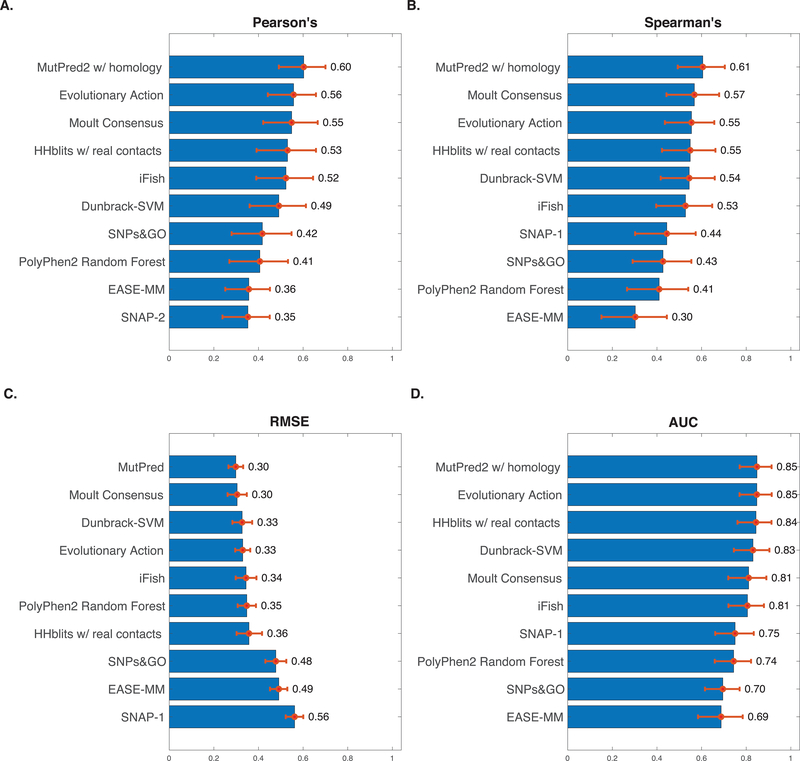
Figure 1.
Resulting evaluation metrics for the top model for each team (A: Pearson’s r, B: Spearman’s rho, C: RMSE, D: AUC). Error bars represent empirical 95% confidence intervals for each metric generated through 104 iterations of bootstrap sampling of data-points. Only the top performing model for each team is shown for each metric. AUC was calculated by designating missense mutations with less than 0.15 observed fwt activity as positives (Predictor Performance Evaluation). Resulting metrics for all models are available in Supp. Table S1 and Supp. Figure S2.

