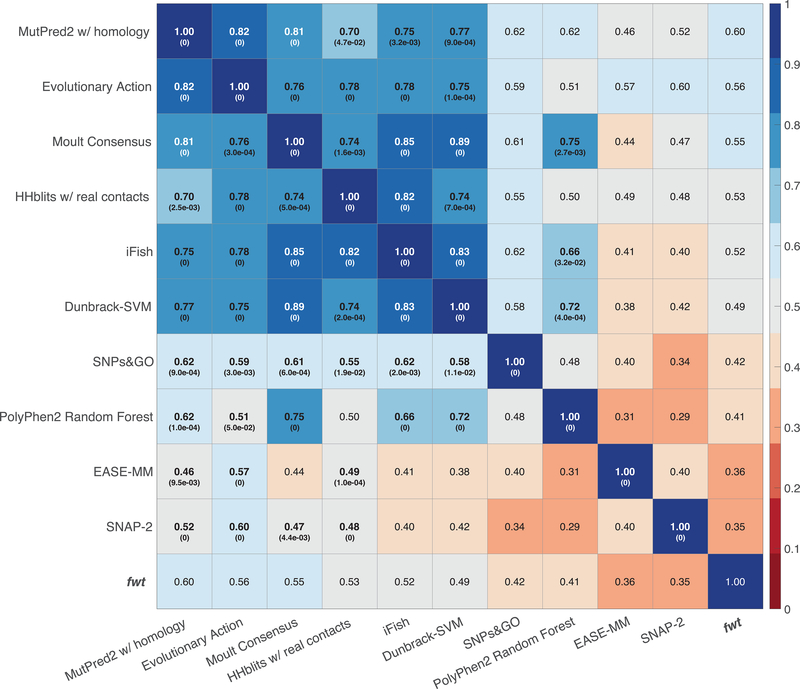
Figure 3.
Pairwise Pearson’s correlation coefficients between each team’s top model as well as observed enzymatic activity values. A bold/starred value for row i, column j indicates that method i is statistically significantly more correlated with model j than with fwt values at the 0.05 level. Statistical significance was calculated as described in Methods. Pairwise Pearson’s correlation coefficients, standard deviations and p-values for all methods, including supplemental methods are shown in Supp. Tables S4–S6 and Supp. Figure S4.

